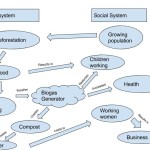
My diagram begins with a growing population in India which then leads to the deforestation in India. My diagram then goes to show that firewood resulted in Children working, which was then replaced by cow dung and supplied the Biogas Generator. The Biogas generator not only decreases the number of children working but it also increases the health of the people. The remains of the generator is mixed with worms and different materials that result in compost, which then creates improved fertilizer. The fertilizer provides women with job opportunities which then results in increased business.
My diagram is similar in structure to Gerry Marten’s figure 1.5 in his reading “What is Human Ecology”. We also both focus on how the generator is fueled and what the outcomes are. This diagram made the connection between human-environment interaction more clear to me. You get a good look into systems perspective, where in this case, the human system and the environmental system intertwine. By using this generator, the interaction between humans and their environment is producing a positive feedback loop and you can tell this because there’s a repetitive action continuously reoccurring (women working with improved fertilizer) furthering business.


Hi Lexie, great diagram! I like how almost every aspect of the chart is linked in some way, but also is very easy to read and understand. I also agree that creating and comparing diagrams made the human-environment interaction much clearer. The concept of positive and negative feedback loops is much easier to understand when it is put in simple enough terms. If you want to check out my blog post, go to:
http://geog030.dutton.psu.edu/2016/01/26/module-2biogas-in-india/