
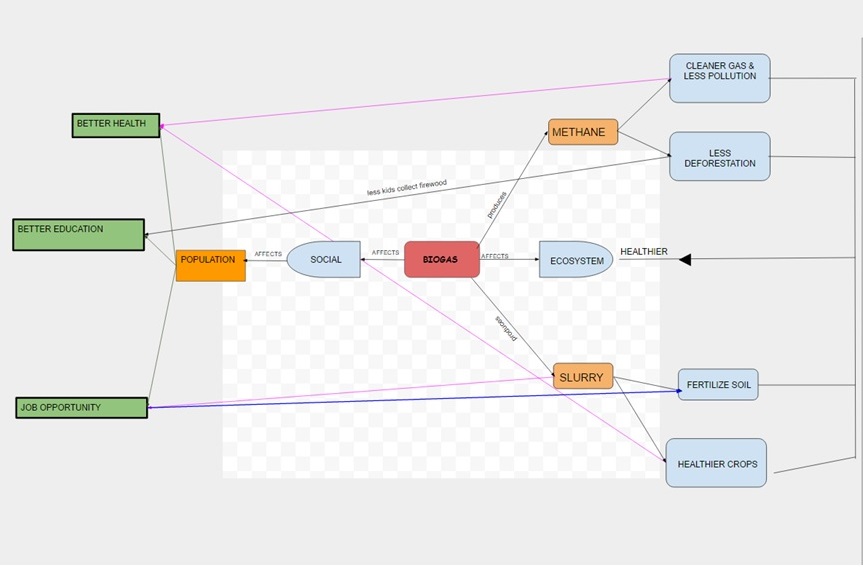
The provided system diagram that I’ve made is relatively simple to what other students might have and also from Marten’s diagram. What I’d like to show in the diagram were mainly how the biogas technology impacts both the ecosystem and the social system of the part in India which applies the biogas system. This invention produced two major products; methane gas and slurry. Both of these outputs brought various effect to fore-mostly the ecosystem, then affecting the social system as well. The production of methane gas leads to less environmental pollution and also reducing deforestation due to the people having an alternative energy choice for cooking. This in return will benefit the people health-wise and allow the children to go to school instead of gathering fuel. The slurry, on the other hand will help local farmers to fertilize their soil and grow healthier crops. At the same time, the slurry provides a certain group of the population (mainly women) with job opportunity by processing them into fertilizers to sell to farmers. Both the farmers and the women will gain economic profit from this.
For the most part, this diagram is much simpler and straightforward than that of Marten’s. It is similar in a way that both charts are divided into two major divisions- social system and ecosystem. Also, this diagram shows the effect that all outcome from the ecosystem side eventually leads to a healthier ecosystem, which isn’t shown in Marten’s diagram. Comparing the two diagrams, I think we could all learn more from the more complex relationships appearing on Marten’s illustration because he listed along the products and processes that goes along in the exchange of points such as cooking fuel, cut wood or put in biogas generators.
Hi, I’m Rachel. I actually really like your diagram, probably because it is so simple. I like that you focused on the production of methane and slurry, and how that impacts the social system in India. I chose to focus on the overarching theme of how Biogas helps create a more sustainable lifestyle. Thanks for sharing your ideas, you can check out my blog if you want!
https://wp.me/p3RCAy-ba4
Hey Syed!,
I’m Dorish Nguyen and I’m currently a freshman studying aerospace engineering at Penn State University main campus. Honestly, what caught my eye about your diagram was that you left the transparent square in the backdrop, which made me laugh and caused me to click on your diagram. After looking at your diagram however, I truly appreciate the simplicity of it because it is easy to understand and not too confusing as other diagrams I have seen on this blog. In my system diagram, I also color coordinated the ecosystem and social system effects, which made it easier to understand what corresponded with what. I also included better health, education, and job opportunity as my social effects and a few similar ecosystem effects. However, unlike your post, I did not include methane, population, or slurry, which I actually really like about your post because it adds a greater category in regards to the smaller subcategories of cleaner gas and less pollution and less deforestation and creates a better understanding of what entails these connections.
Great post and please check out my blog post if you get the chance!
http://geog030.dutton.psu.edu/2016/01/27/42886/
– Dorish Nguyen