
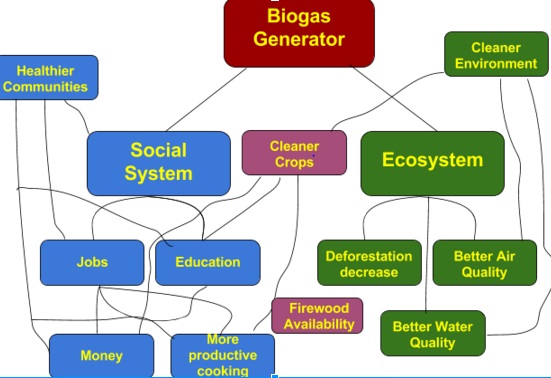
In my diagram, I used lines as opposed to arrows to simply show a correlation between the two subjects. The biogas system is a very relevant of a Coupled-Human Environment System that was discoursed in Module 2, where the interactions go beyond what would normally take into account. Much like the figure shown in the reading assignment, my diagram portrays 2 general categories; the Social System, and the Ecosystem. However our diagrams also portray differences, the author takes into account many more factors and correlations. I believe the biggest issue with these systems is the upfront money and resources; which seems to me that most of these communities struggle to come up with. From both of these diagrams, the reader can better apprehend what ties into a composition when both an ecosystem and social system are integrated in the way this biogas generator. I believe it can be well understood that the author and I hold different views, and I can also say that the author is definitely more well-educated on the subject that me. Asides from knowledge on the topic, it can be pretty clear that the theme of these systems also relates heavily to points of view. What I mean by this is that there is no right or wrong answer but rather different perspectives that one may or may not disagree with.
Hi! My name is Kristin and I am a senior. I really enjoyed reading your post and looking at your biogas diagram. Your post stuck out to me because the colors you chose were very appealing and I liked how it helped separate the three different sections. My diagram also addressed a lot of the same aspects as yours! I also started out my diagram with biogas and then broke it into the two sections of social system and eco system and as well included health, eduction, cleaner air, deforestation, etc. However, I like how yours has several lines connecting a lot of the aspects together! I agree that these diagrams really help give readers a better visual to understand this concept.
If you want to check out my post here is the link:
https://wp.me/p3RCAy-b42
Hello! I’m Tom Devenney and your system caught my eye because the colors were very nice to look at. I like how your diagram uses lines instead of arrows because the lines show how the two systems affect each other instead of one affecting another, which is a notable difference between our diagrams. I agree that this is an example of a Coupled Human-Environment system. I also agree that there are differences in points of view that could lead to differences in systems diagrams. Here is a link to my post:
http://geog030.dutton.psu.edu/2016/01/27/thomas-devenney-learning-activity-module-2/