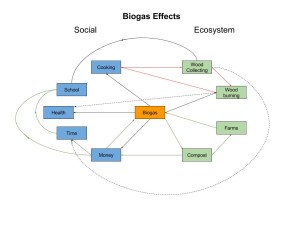
This diagram demonstrates the social and ecosystem effects that the introduction of biogas induces. The arrows indicate how one component interacts with another. For example, biogas produces compost, which can be sold for money, and used for farming. The diagram shows three positive feedback loops (green) and one negative feedback loop (red). One example of a positive feedback loop is that biogas produces compost, which is used on farms, which in turn make more biogas. The negative feedback loop is produced when biogas is introduced. normaly cooking requires wood burning, which requires wood collecting. When biogas is introduced this need for wood burning decreases, which means the need for wood collecting also decreases. Both the wood collecting and burning had adverse affects on schoolwork, time, and health, so the negative feedback loop has a positive effect on the system. When comparing this diagram to figure 1.5 in the Marten reading, it can be noted that there are many differences. This diagram breaks down the social aspects into health, money, time, cooking, and school work, while figure 1.5 uses a broader range of the human population. Figure 1.5 does not clearly show the social benefits such as improvement to health like this figure does, which is something that can be learned by examining both figures. They do use very similar concepts however, which is what makes them similar.
2 thoughts on “Biogas System Hollabaugh”
Leave a Reply
You must be logged in to post a comment.


Hello my name is Michele and the main reason for why your diagram caught my attention is its simplicity and straightforwardness, unlike mine:http://geog030.dutton.psu.edu/2016/01/27/biogas-generator-in-india/ . I love how you really just took all the main concepts and interconnected them in a very legible way and then you further explained the effects and the relationships in your summary.
Hi my name is Ben Ceci and I saw that we had a similar format in our diagrams. We both used Social Systems and Ecosystems as our categories. I liked how you connected everything back to the biogas section in the middle. Your diagram was very easy to read and to the point. I liked it a lot. Here is a link to my post. http://geog030.dutton.psu.edu/2016/01/27/42975/