
The idea of my figure is supposed to show many positives of the biogas and negatives of having to use firewood. Many children loose valuable school time due to their time spent looking for wood in order to have food to eat. In addition the firewood and cooking on the fire stove can lead to health issues for the children and family. Although it is only in a diagram I tried to illustrate that the ecosystems and social system interact with each other which leads to affects on both sides. The poor ecosystem in India leads to human health depravity, and as a result humans affect the ecosystem adversely by chopping down trees and other such things. There is some good benefits to the biogases. As we learned in module 2 there are benefits of coal technology because it reduces deforestation however increases air pollution. The biogas not only produces energy to stop deforestation but also uses gas that is already being given off even if it were not used! My diagram is somewhat different than that of Figure 1.5 in some categories. Their diagram has a lot of farm and tree boxes and mine has more of the elements that have to do with fuel. I think both diagrams do show the positives of the biogases by showing effects and the processes of them. I feel as though both are more the same because biogas seems to have the same effect in all areas. I think we can learn through both diagrams that it is beneficial to use the biogases for not the country of India but the whole world!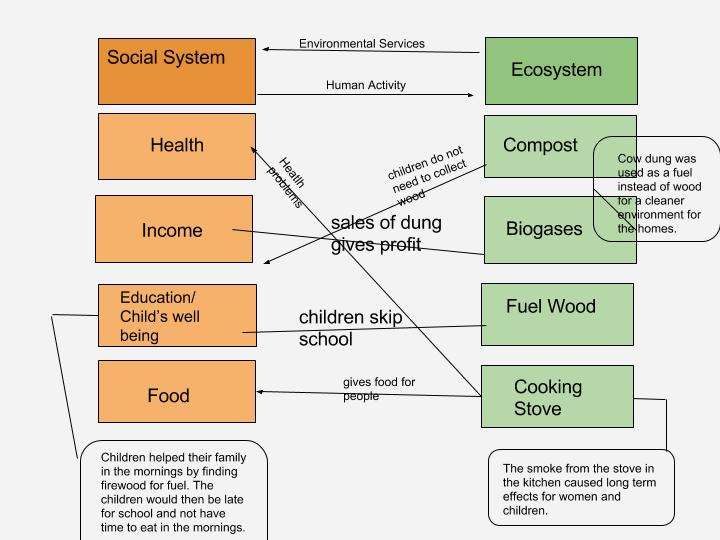
2 thoughts on “Diagram on Biogas”
Leave a Reply
You must be logged in to post a comment.
Hi my name is Matt. Your post caught my eye, it looks really well done and nicely put together. We share a similar theme in out entries showing the cause and effect of this particular ecological system. I liked that you explained how coal could also be used as a resource, I think it was a smart idea bringing in another example of a viable fuel source.
http://geog030.dutton.psu.edu/2016/01/27/blog-post-2-pavelko-fox/
Hi my name is Ryan Daley. I liked your entry and diagram. It interested me that you showed the interaction between kids losing school time and collecting wood. I went in the direction of showing how the women interact with the ecosystem to maintain a sustainable way of life. I think the biogas generators are great and full of mostly positives.
http://geog030.dutton.psu.edu/2016/01/27/module-2-ryan-daley/