
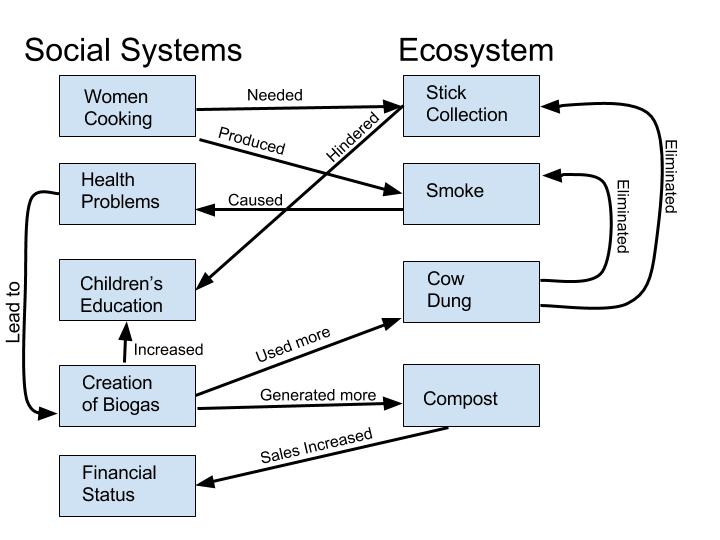
My systems diagram shows the interactions between social systems and ecosystems. I started with women cooking and how this all lead to the creation of biogas. The simple act of cooking was leading to environmental destruction, by collecting wood, limited kids’ education, since they spent a lot of time collecting sticks, and causing chest infections because of all the smoke. This diagram shows all these interactions and then how the creation of biogas solved these problems. The creation of biogas is an example of a positive feedback loop because an initial change lead to multiple outcomes. For example, biogas lead to more production of compost which the sales of this increased income for the women of the society and this cycle would keep going as the use of biogas increases. Similar to Marten’s Figure 1.5, I categorized social systems and ecosystems on separate sides of the diagram. I think this way is to better organize what the diagram is trying to prove. Ours is different because he also focused on how the compost can lead to food for the human population; I think he focused on more outcomes than I did. I think by looking at both Marten’s and my diagram, a reader could see how society was before and after biogas. I focused on problems not having biogas was causing and he focused on what happens after biogas is brought into the world.
Hi Jessica! After looking at your diagram, I realized ours are similarly set up. I put the social systems on the left on the diagram and the ecosystems on the right side, like yours. We also touched on a lot of similar points on both sides of the diagram. Like John stated in the previous comment, I thought it was interesting how you put “stick collection” and “smoke” to be eliminated by “cow dung.” It was an approach I had not thought of. Feel free to check out my diagram to see how ours compare!
https://wp.me/p3RCAy-aZc
-Sophia
Hi Jessica! I thought your diagram was similar to mine in that we have some of the same bullet points. I thought it was unique how you described the stick collecting and smoke as eliminated by cow dung. I thought that was a different but intuitive approach to it. If you’d like to see my blog for the similarities, it can be found at:
http://geog030.dutton.psu.edu/2016/01/23/biogas-diagram-john-windt/