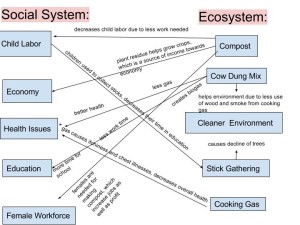
One of the core ideas in regards to my diagram is the effect that cow dung has on both the environment, education, and workforce of India. The human-environment system clearly shows that while humans impact the environment, the environment affects humans as well. For example, due to the use of cooking gas, this impact led to itching of the eyes, as well as cough/chest health issues. When children and females in India were collecting sticks for the use of cooking, this impact led to the decrease of trees; an overall unhappier environment due to our impacts upon each other. Once positive changes were made, for example, cow dung mix; the use of less gas and sticks caused an overall increase in the health of the humans and a cleaner environment. The use of the sticks and gas was a disturbance to both the humans and the environment, but the resilience, our ability to recover after this disturbance, led to positive changes such as increase in the workforce, education, and health. In comparison in the Marten reading “What is Human Ecology?”, both our diagrams have the two main components of social system and ecosystem. Our idea of using two-direction arrows indicates that the Marten diagram and mine both have the same general idea of the human-environment system and how they both impact each other. This is a similarity that can be learned by realizing this is a system diagram that is consisted of several components that interact, and affect each other; a systems perspective. In contrast, Figure 1.5 focuses more on the possible future benefits that biogas has towards villages, while my diagram is based upon benefits that already occurred to the villages because of the positive changes. His introduction to these benefits could lead to unknown thoughts and discussion that maybe wasn’t possibly thought about.
3 thoughts on “Cassandra Oresko: Module #2”
Leave a Reply
You must be logged in to post a comment.

You have some outside of the box concepts under both systems. You are also very specific with your selections. They pertain to the video perfectly. Compared to my diagram, we have a significant amount of differences. Its interesting to see what the rest of are thinking for this exercise.
My post can be found at http://geog030.dutton.psu.edu/2016/01/24/42301/
Hi! I thought it was interesting how you used the idea that the use of cow dung creating the effect rather than talking about the Biogas Generator. I agree with this idea that without the cow dung, there would be no biogas generator to begin with. Our diagrams our very similar because we both have the two sides with general idea that having connecting links. However, in yours, I really liked that you described what was happening between them compared to mine that just says that it increased or decreased.
Here is the link to my post: https://wp.me/p3RCAy-aZV