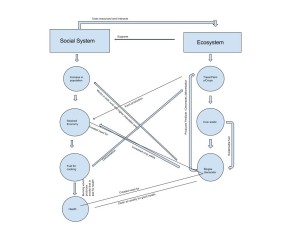
In my diagram I focused mainly on the relationship between the social system and the ecosystem in India and the direct effects of a biogas generator. The IPAT focuses on the world scale and has intricate interactions noted, unlike the more general relationships noted in my diagram. Both of the diagrams show that there is many different ways in which these relationships interact within the larger system. Everything is connected in some way or has effects on other relationships or colorations within the larger system. The more detailed the more accurate and intricate the diagram becomes. Diagrams like this help understand the interworking’s of the different systems to help provide a better way to read data in relation to these intricate relationships.

