
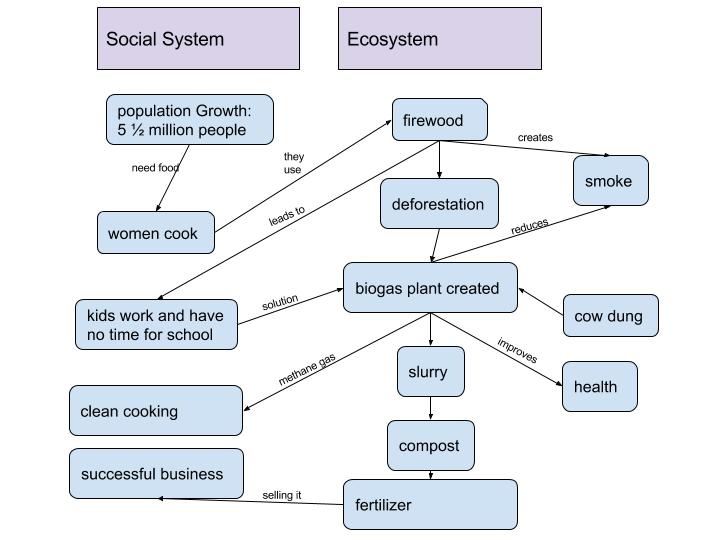
Biogas in India is just a small step that was taken to help out the ecosystem. The social system and the ecosystem influence each other and as I read in the reading, the equation: I = P x A x T (ecosystem = population x affluence x technology). It relates to the system diagram we read and then created because it shows that everything impacts the ecosystem. From the population growth, so many things can happen throughout the environment (using firewood to cook) that cause a negative reaction, but can change to positive by changing what is happening in the environment, which then causes change in the social system.
Comparing my diagram to Gerry Marten’s 1.5 Diagram in “What is Human Ecology”, I notice a lot of similarities. We have the same ideas, however his seems to be more specific. Also, my diagram seems like more of a cause and effect mostly, but in his diagram, it seems that everything ties in with each other. I think what I’ve learned from these comparisons is that everyone has their own perception of how everything is connected and how the social system and ecosystem effect each other. I also think that everyone has an understanding that it is a cause and effect situation because something that happens in the social system will cause something to happen in the ecosystem and vice versa.
Thank you for your comment on my post. Your diagram is very detailed and complete. One thing I didn’t mention in my diagram at all was the reason for the two fuels, cooking. I also didn’t think of how increased fertilizer could lead to better crops not only making money for the coffee producers as mentioned in the video but also making better food for the people cooking and animals providing manure.
http://geog030.dutton.psu.edu/2016/01/27/42864/
Hi Caitlyn, your diagram design stood out to me as I found a lot of similarities between yours and mine. I think we both definitely focused on the bigger picture of the effects of having a Biogas System in the Ecosystem. Compared to Figure 1.5, both of our diagrams have a similar separation of systems, but less of a cyclistic connection of components like Figure 1.5 has. Feel free to check out my post here: http://sites.psu.edu/geog30/2016/01/26/module-2-biogas-system-diagram/
The explanations on the arrows describing how each of your topics in the diagram are effected is what I like best about your diagram. They really help me understand the information you presented so much better. If you would like to see how I presented my diagram, please click this link http://geog030.dutton.psu.edu/2016/01/26/module-2-biogas-in-india-5/