
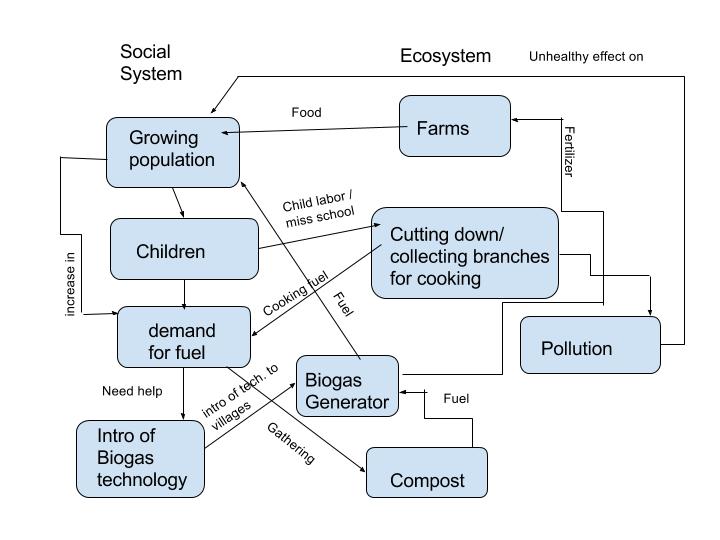
The core ideas behind my diagram is to show the environmental and social effects of the Biogas generator. As we learned in module two, the system works as a human- environment system as most systems we see every day do. The diagram has both negative and positive feedback loops. An example of a positive feedback loop is the overgrowing population has a source of food from the farms. The effects overall benefit the social system and ecosystem. The population can now use Biogas as a source of fuel, in which helps the ecosystem by the reduction of cutting down trees. With this technology India can accumulate a greater resilience meaning that disturbances such as a population spike won’t cause huge problems. As you can see from my diagram firewood creates pollution from smoke which has a negative effect on the population. The introduction of the biogas generator decreases the environmental impact and lessens the health effects on the population.
My diagram is very similar to the one in the Marten reading. Most of the similarities lie under the ecosystem side. Both diagrams have the concept of the biogas generator, farming fields for food. The differences between Figure 1.5 in the Marten reading and my diagram is that I consider the pollution effects from smoke from the firewood. I also consider the fact that children will be missing school to collect wood to burn. This diagram was also difficult for me to make. Mine is harder to read than the one in the reading. The two diagrams are different because everyone interprets the information differently. Something I put on my diagram someone else might not think of. I may have focused my diagram on different aspects than the one in the reading causing them to be different. What we can learn by these different comparisons between the two diagrams is that everyone interprets information in their own way.