
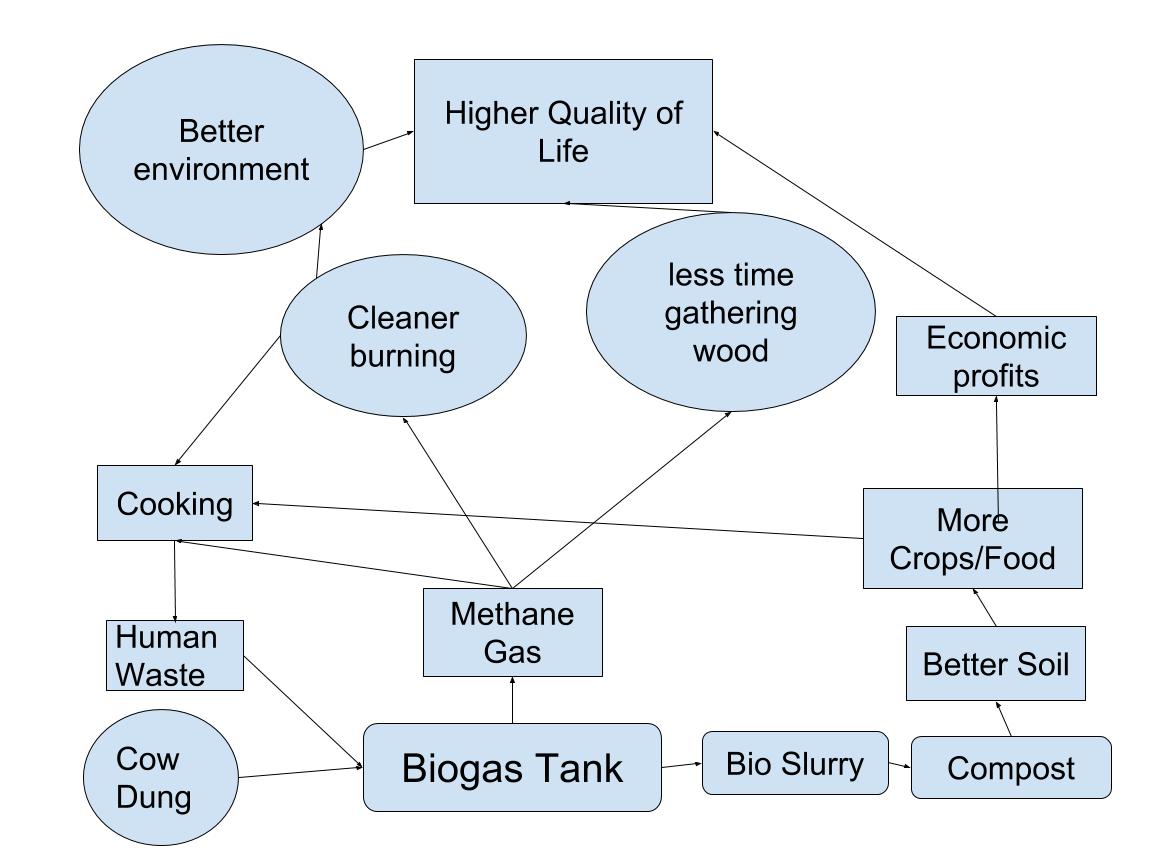
 The core ideas of my Bio-gas diagram are to show how the proper and efficient use of common animal and human waster through bio-gas tanks can both help the environment and improve the overall quality of life for poverty stricken rural areas of India. Another important idea we discussed in this lessen are feedback systems. The bio-gas diagram shows how we are directly influenced and affected by our environment as well as we directly affect it. the bio-gas tanks in India do an excellent job of both having a positive affect on human quality of life as well as improving environmental conditions. This is important because many times human comfort is held above environmental quality when we look for economical and technological progress.
Marten’s diagram is similar in that it focuses on both the environmental effects and human impacts the bio-gas technology has. the key difference is that Marten’s diagram does not focus on the bio-gas technology as the key element in this diagram as I have, instead Marten recognizes that it is only a small piece of the puzzle and its creation was driven by social, economical, and environmental pressures that brought about the development of bio-gas technologies. I believe that is the key takeaway from comparing these two diagrams and if I were to redo mine I would centralize my diagram around those issues rather than the bio-gas tank.
Hi, I really like both your diagram as well as your discussion about the diagram presented in the Marten reading. I think that it was really important to point out that he saw it as a smaller aspect in the grand scheme. Your diagram is very clear and I like how you added “Higher Quality of Life” as one of your bubbles. Here’s a link to my post, if you’re interested! (https://wp.me/p3RCAy-b5c)
Hey, I thought you did a good job on your diagram. I liked how you make it into a loop and brought everything back to the biogas tank. I did something similar in my diagram except I brought it back to the social system and ecosystem to show how everything will always come back and affect those two things in some way. If you’d like to see it here is a link to my blog (http://sites.psu.edu/geog30/2016/01/27/module-2-kevin-hosterman/)