
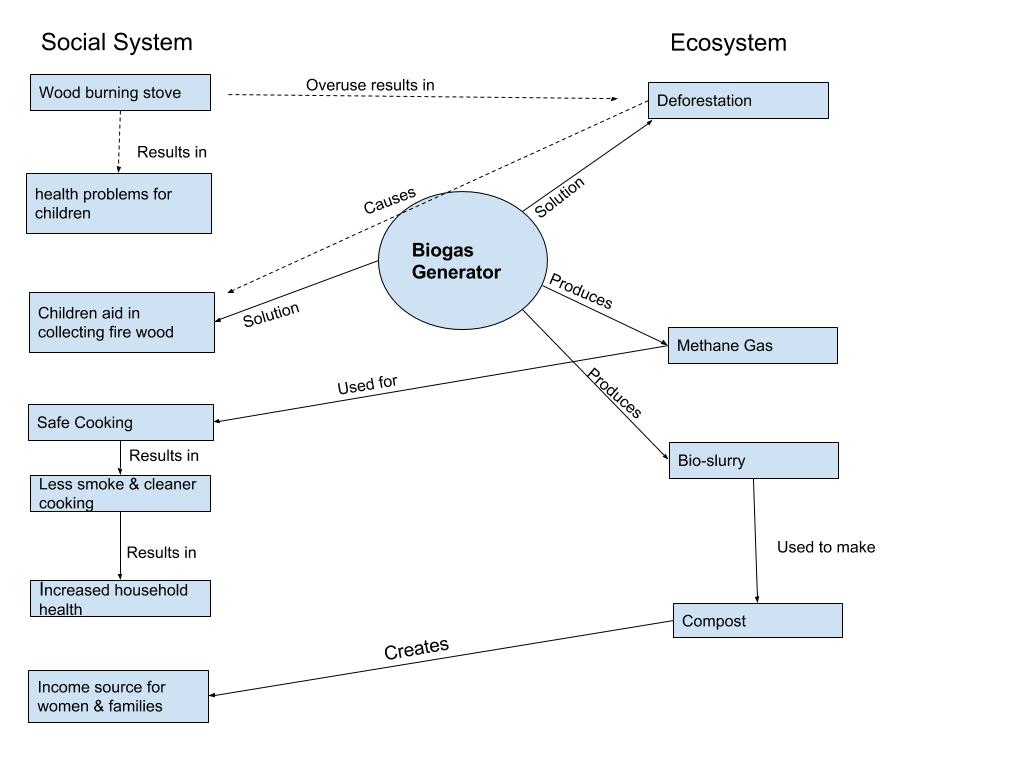
As I was creating my diagram I was attempting to illustrate the importance of the relationship between one social system, Bangalore, India and its surrounding ecosystem. Together these two systems can have both positive and negative effects upon each other. For example in this ecosystem people have both a positive effect on the ecosystem by creating compost used for fertilizer and they also have a negative effect by creating deforestation. On my diagram the negative impacts are shown through dashed lines while positive impacts are shown through solid lines. These two groups worked as a coupled human-environment system based off of the way that they both affect each other in different ways. Under the social system side you can see that the people of this community imposed negative impacts by the way that they caused deforestation and also caused health problems amongst the people of their community. But with the introduction of the biogas generators they were able to create many positive outcomes for both the community and the ecosystem.
In comparison to Marten’s 1.5 Figure and my systems diagram, there are some similarities and differences. Both Marten’s and mine have some of the same topics such as Children, cooking, deforestation, and biogas generators. However, there are some differences in that my descriptions on my arrows are less detailed than on the 1.5 figure. By comparing both diagrams, individuals are able to interpret the information differently. One individual might think a topic is important to include while another individual may not. It is very useful to compare and contrast these diagrams in order to see other impactful topics I may have not included.
Link to my blog: https://geog030.dutton.psu.edu/2016/01/27/biogas-generator_bdb5296/
I forgot to add in a link to my post!
It’s https://wp.me/p3RCAy-b5O
Hi Benjamin, my name is Dylan Hellings (Here is my post if you are interested: http://geog030.dutton.psu.edu/2016/01/27/module-2-biogas-diagram-dylan-hellings/ ) Our diagrams have several similarities. One difference I noticed was that you added about the income source for women and families. This is a great point as it’s a huge social benefit of biogas. Not only does it affect the social system but compost is highly beneficial for the growth of crops. This then comes full circle in feeding the animals to create compost from the animal waste!
Hi Benjamin,
My name is Alex and I’m a student at the Worthington campus. You did an awesome job on your diagram! It’s well thought out and very clear! I didn’t decipher between the ecosystem and social system clearly in mine (whoops) so yours caught my interest. I also like that you used dotted lines to show negative impacts. I also brought up the concept of deforestation and how these factors can have negative effects. I like that you pointed out that different diagrams help different people interpret the information in different manners. Again, great job!