
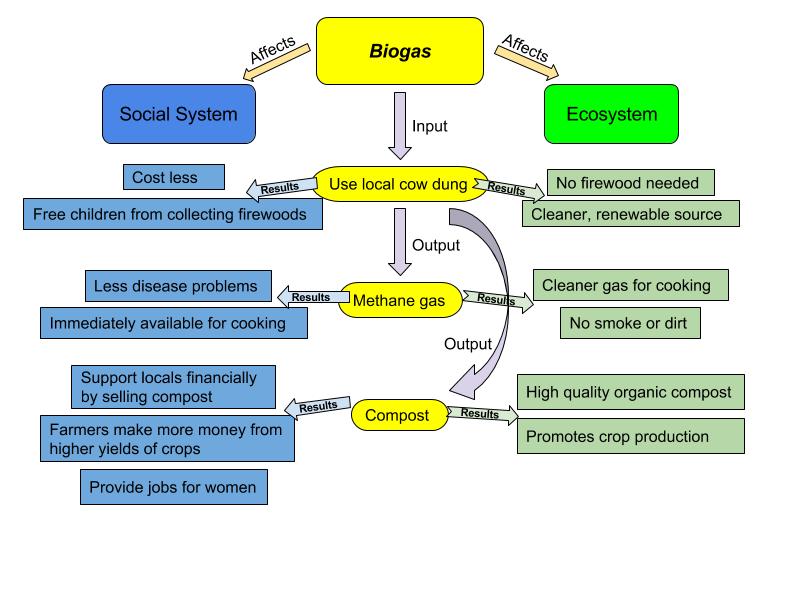
This image above is a system diagram for biogas in India, with system diagram, we can better understand the relationship between system’s components. In the diagram, we can see that how biogas affects ecosystem and social system, biogas generator uses locally accessible cow dung to produce clean methane gas, and the “leftover” slurry can be used as organic compost, which should be seen as a sustainable development since it doesn’t compromise the resources of the future generations. When comparing my diagram to the one in “What is Human Ecology?”, the same part would be that we both use arrows to show the effects, the different part would be that I use the procedure of producing biogas as a “tree trunk” and present the effects in two categories, but in the reading the author list the major topics under the two categories and find the relationships between the topics. I think the reason why we have differences and similarities is that we both know arrow can help us clear our thoughts and trace the chain of effects, but we have different ways to arrange the information. By comparing the diagrams, I think I would focus more on the correlation between different effects rather than just listing them under different categories, and I would also consider sing line arrows since it makes the diagram cleaner.
Hi Siying!
My name is Jacqueline Jimenez and I think you did a great job on your diagram! I really liked how you broke it down to three different colors which made it easier to follow. Both of our diagrams talk about the most important topics that were covered in the video. I thought that you also did a really good job in your description and I was especially interested in how you compared it to a tree trunk because it gave me a really good visual on how you were trying to come across with your diagram.
Here’s a link to my diagram!
https://wp.me/p3RCAy-bbw
Hello Siying Chen!
Your diagram caught my attention. I really like the use of color coding the blue social system to the light blue affects, as well as the green with the ecosystem. Your diagram is quite different than most because it clearly states the results, rather than having the viewer infer the conclusion. I also appreciate that you refered to the biogas as the “tree trunk” to your diagram. If you had more time it might be interesting to impose this diagram onto a tree illustration, and maybe make the results as fruit hanging from the tree.
Anyway, great job! Here is a link to my blog post if you’d like to read it; https://wp.me/p3RCAy-bbb.
Hey Siying, I like the way you made your diagram. Our topics in our diagrams are fairly similar but yours are a little more detailed than mine. I like the “tree trunk” design of your diagram. I think it’s easy to read and understand.
Check out my post: http://geog030.dutton.psu.edu/2016/01/27/biogas-system-diagram-michael-celoni/