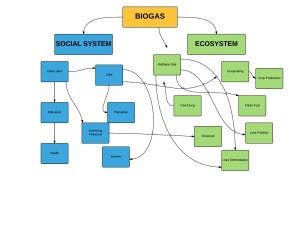
The system diagram above conveys the Human-Environment System by displaying the vast interactions of the social system and ecosystem within the biogas revolution in India. The diagram shows both the positive and negative impacts of the technological development of biogas culture. The wood burning culture had created poor health effects due to wood burning, it forced child labor for collecting firewood, and caused deforestation. The new biogas culture allowed for a cleaner environment, less health effects, and less deforestation. It also created new jobs and wealth which allows the human population to flourish.
In comparison with the Marten system diagram there are similarities and differences. Both the Marten diagram and my own showcase the various interactions of the Human-Environment system. They display the affects that human decisions have on the environment and the way the environment affects human decision making. They differ in that Marten has more specific cross interactions between the two. Mine could have used more wording in the cross between to be more complete. I think these similarities and differences help to showcase where one puts emphasis on certain decisions and where others may be overlooked. I think it is important for things to be analyzed from more than one perspective so that we get a more complete picture of the interactions from a research perspective.


Hi! I’s Ben Bishop and I’m a freshman and PSU University Park. I loved your post because of the similarities in our chart. Some similarities you may find between our two charts are the effects of biogas generators. Also some differences are that i have labeled arrows, you do not and that you have biogas as the very top of your chart while i have it as the center. I would love it if you look at my blog and tell me what you think!
Heres a link to my blog incase you want to check it out!!
http://sites.psu.edu/geog30/2016/01/27/biogas-generator_bdb5296/