
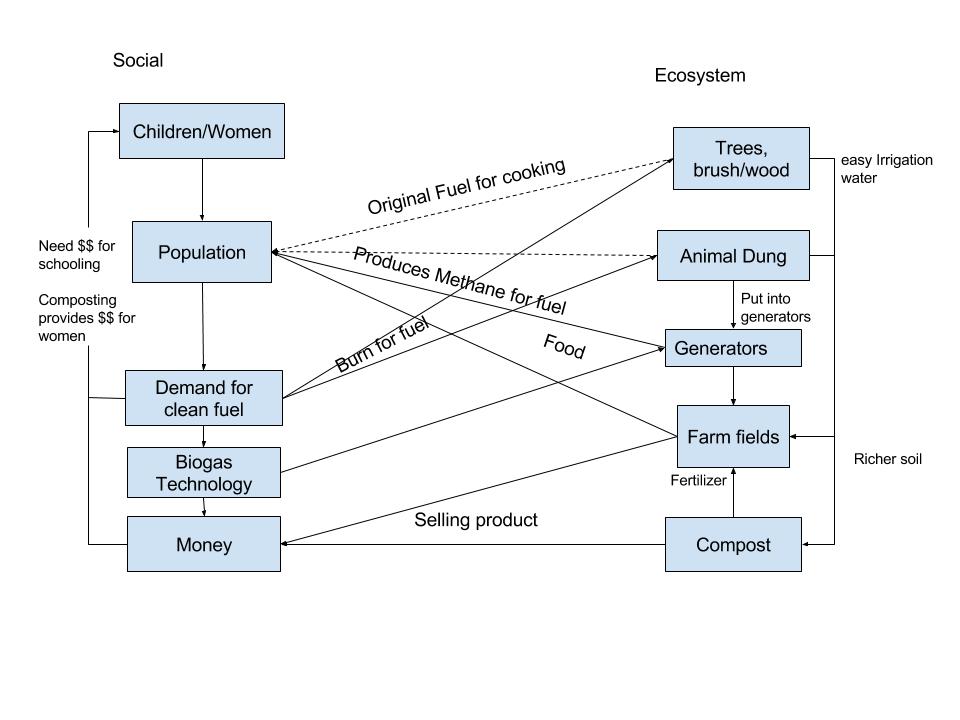
In the diagram I created, I illustrated the relationship between the social system of the Indian village and the ecosystem surrounding them. Using the arrows to help label usage and direction, the illustration shows the demand for fuel and what is affected in the environment in relation as well as a solution. The presence of humans in this particular area has disrupted the natural flow of the environment. For example, the need for fuel caused the villagers to chop down trees and bushes to gather wood to burn which in turn created the problem of deforestation leading to the demand for an alternative fuel leading to animal dung and basically anything that they could burn. It was when biogas technology was created and put into effect using generators that utilized animal dung to create methane that an alternative fuel was found. Methane proved to be that solution of clean fuel which benefited everyone in the end considering the mixture could be made into fertilizer that women sold to farmers to make money for school and the farmers used to grow crops.
Compared to the diagram in the reading, my illustration is rather similar. It would seem I used the same layout that the author used in the reading with the stacked square boxes and arrow lines to signify relationships.
The main difference I see is that I added money into the equation considering money was an issue for the villagers and specifically the women that were looking to send themselves and children to school. The compost was stated to be the money maker in the video that women were able to sell the rich soil to farmers for a profit.
One could say the similarities stem from the fact that the same information was presented to the authors of both diagrams. On the other hand, differences from different thought processes and interpretation of the information.
Need creates demand which pushes motivation to progress an economy. This village is now generating revenue from sales of compost and creating an efficient source of fuel.
Hi! My name is Karissa. Check my post out if you have a chance https://wp.me/p3RCAy-b7A
Your post caught my eye due to your use of feedback loops in both the Social System and the Ecosystem. This was an aspect of Module 2 that I did not portray in my own diagram. But I like the connections that you made because it not only puts the given video into perspective, but also breaks down the information into more understandable terms. I also see similarities between your diagram and Figure 1.5 from the reading. This shows me that you have a similar mind set to the author apart from minor differences, such as your addition of money which was mentioned in your post. Overall your diagram was well organized and obviously created with great precision. Good job!
Hi JMW5890,
My name is Ralph Diaz. I found your post particularly interesting because you highlighted a difference between the social and environmental ends of the generator’s impacts. I personally found this very difficult to do in my diagram because they were so interconnected, but you were able to show a distinction without alienating the two from each other. If you don’t mind me saying, some of the arrows in your diagram make it a little confusing, for instance, the relationship between money for women/ children and the demand for clean fuel are not apparent. I like that you included how each of these aspects impacted population because the influence on population is an important aspect that I could have done a better job of highlighting. If you want to check out my post then go to this link: https://wp.me/p3RCAy-b74
-TJ Diaz
I cannot seem to find your name, so I shall just say “Hi”. My name is Samantha Sessamen, and I took the time to read your Learning Activity blog post. I took a more general approach in my categories, but I like how you illustrated that there are many ties between the social system as well as the ecosystem. Viewing everyone’s diagrams really opens up our eyes to see that we all view the world differently.
Here is a link to my blog: http://geog030.dutton.psu.edu/2016/01/27/learning-activity-biogas-system-diagram/