
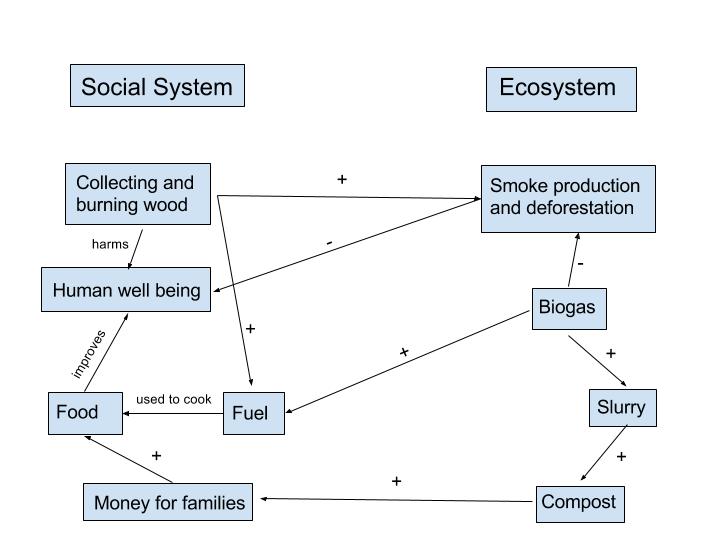
The core idea behind my diagram is that humans’ social systems interact closely with their surrounding ecosystems, and that changes to our social system can cause drastic changes to the entire system. This human-ecosystem interaction can be clearly seen in the immense impact that one innovative piece of technology can have on an entire community. My diagram charts the interaction of a rural Indian village with a biogas generator that has been introduced to improve their quality of life. The diagram displays how people used to collect and burn wood in order to cook their food, which resulted in harmful smoke production as well as contributed to deforestation. The biogas generator removes the need for wood as fuel, which effectively stops the positive feedback loop of cutting and burning wood. The biogas generator also produces slurry that dries into compost, which can be collected and sold by families for profit, which ultimately increases the sustainability of the community.
In a comparison between my diagram and Gerry Marten’s, there are a number of notable similarities and differences. Both diagrams separate the social system and the ecosystem, which helps clarify the interactions of each. One way that the diagrams differ is in their content and attention to details. Marten’s diagram specifically addresses the dynamic between children and fuel gathering on the social system side, as well as the local landscape and the effect of irrigation. My diagram, on the other hand, takes a more simplified and family-oriented approach to the effects of the biogas generator. I believe these similarities and differences exist because of the inherent unstructured nature of system diagrams and the amount of ways that various aspects can be interpreted. Each person has a different set of experiences and mindsets through which they process the outside world, and visual representations of this are bound to be different. I think that it is valuable to compare different system diagrams, as it gives one the opportunity to identify aspects of the system that may have been overlooked. Additionally, hearing different perspectives on the effect of certain aspects of the diagrams may help clarify their true impacts.
James,
I like how you chose to focus on the effects on a typical small household. Its neat to see how just adding the generator can create so much change within a small system. It makes me wonder how a system like this might benefit larger communities, especially in rural farming areas here in the US.
Ben