
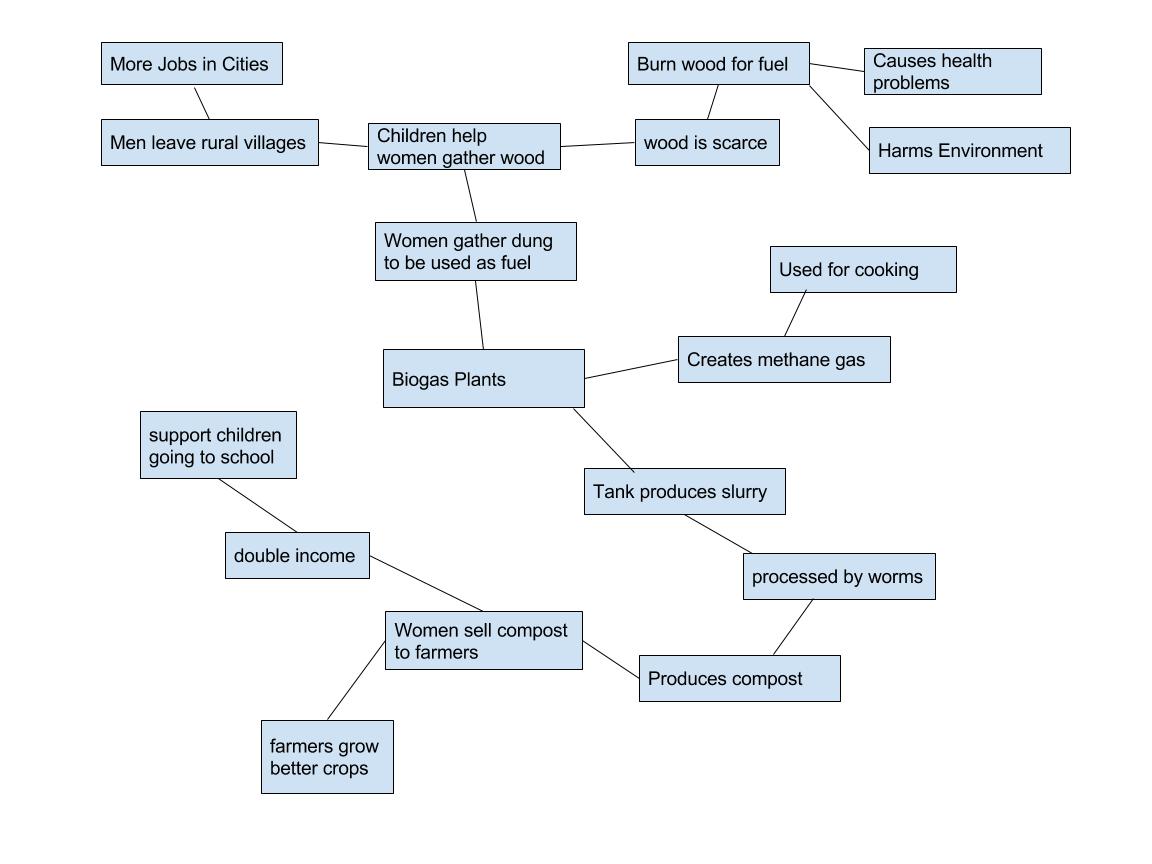
The core idea of my Biogas diagram is that all of the key components are connected. The human ecosystem and the natural ecosystem work together to create a clean energy source for rural villages in India.
My diagram is similar to Figure 1.5 in the Marten reading because they both deal with the issue of scarcity of resources and how the biogas plant provides an ever renewable resource to a community in need. Similarities include The population decline in rural areas, compost being used as fertilizer for crops, animal dung being used as fuel in the biogas plant and many others. A difference between my diagram and the one in the reading is the one in the reading lacks the impact that selling fertilizer to farmers has on the women that sell the fertilizer. The reason for these similarities and differences is because the reading is dealing with a general situation where as my diagram is dealing with a specific case.
By comparing the two diagrams we can learn that any village that requires the use of a biogas plant will have the same basic structure, but in each individual case the biogas plant may have different effects on the components of the village itself, such as the people or the crops.
Hi Steven, my name is Sarah, and here is a link to my blog post: http://sites.psu.edu/geog30/2016/01/27/sarah-gross-module-2/
I enjoyed reading your post, and agree with you on many terms. I find it amazing how almost everything that we do is connected with the ecosystem. This was so helpful in India because it made a much cleaner energy source that was helping both the humans and the ecosystem. The biogas seems like it will help out this town very much, but as technology improves and they get to reach further towns across India, as you said, they will all be affected differently. Great post; I enjoyed reading it!