
The core ideas behind my biogas diagram focused on the components affected by the introduction of biogas systems as alternative fuel for the rural community in Bangalore. The diagram shows the chain effects between the ecosystem and social system.The introduction of biogas system begins with Vidya’s story of his childhood, which was filled with memories of his mother using firewood for cooking and its effects. The hazards of smoke inhalation and the challenges of collecting of firewood were some of his mother’s hardship. For these reasons, Vidya began this endeavour of improving life for the rural areas by introducing biogas generators. The biogas technologies has a great impact to the population in the rural areas plus promotes several sustainable factors for the community. As indicated in my diagram the biogas provides clean sustainable fuel as well as; promoting education, health benefits, income from sale of the compost, trees are saved, coffee farmers have an increase and better quality yield from the compost also clean and safer kitchens. My diagram and the figure 1.5 in Marten’s reading are quite similar due to the fact that both diagram show the ecosystem and social system relationship as well as feedback between the components. My diagram differs because the biogas in my scenario is generated from the animal waste only also Marten’s diagram shows a direct impact of biogas system to the birth rate. There are similarities and differences due to the background narrative for the diagrams. Therefore basic underlying components will be similar and specific effects vary from community to community.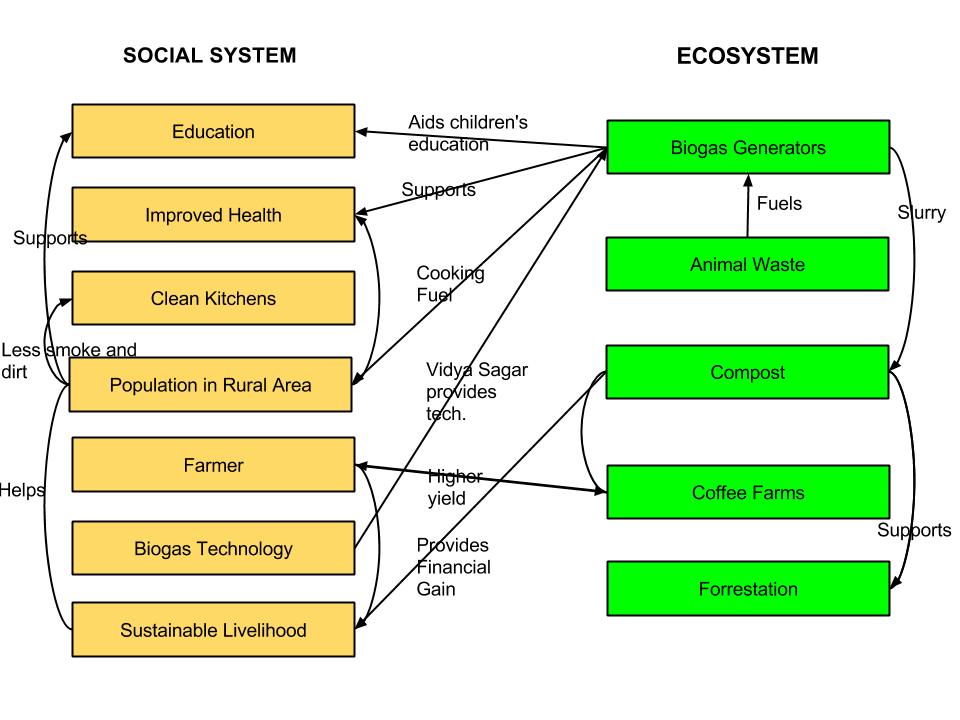
2 thoughts on “M2 Biogas Diagram”
Leave a Reply
You must be logged in to post a comment.
Hi Maureen, my name is Avi. I liked your diagram mostly because of its format and how you divided all components into either part of the social system or the ecosystem. It made it easy to see how both aspects are impacted by the biogas system. It was quite a different approach to what I took, as my diagram is more complex but probably harder to see the individual parts of the ecosystem and social system. The colors also made the diagram easy to read and attractive.
Hey Maureen. Here’s my blog if you’d like to see it. http://geog030.dutton.psu.edu/2016/01/28/module-2-jason-brown/
I like how you added all the titles on the lines and used separate colors. Your lines clearly show what affects what. The fact that you saw how the different topics affect each other was cool, especially how the improved health ultimately helps the population in the rural area. If anything could be added, I would have shown how the biogas generators replaced the firewood and why it needed to happen. Great job!