
- Using Module 10- Biodiversity as a resource, draw a system diagram connecting the Case Study: The Amazon Rainforest to biodiversity. The diagram should have at least six system components and the arrows should point in a logical direction and be explained. Be sure to include plenty of detail about the study, about biodiversity, and about the impacts between the two.
2. In another paragraph, explain what your ideas are behind your system diagram. Be sure to include details so others know what you are trying to portray.
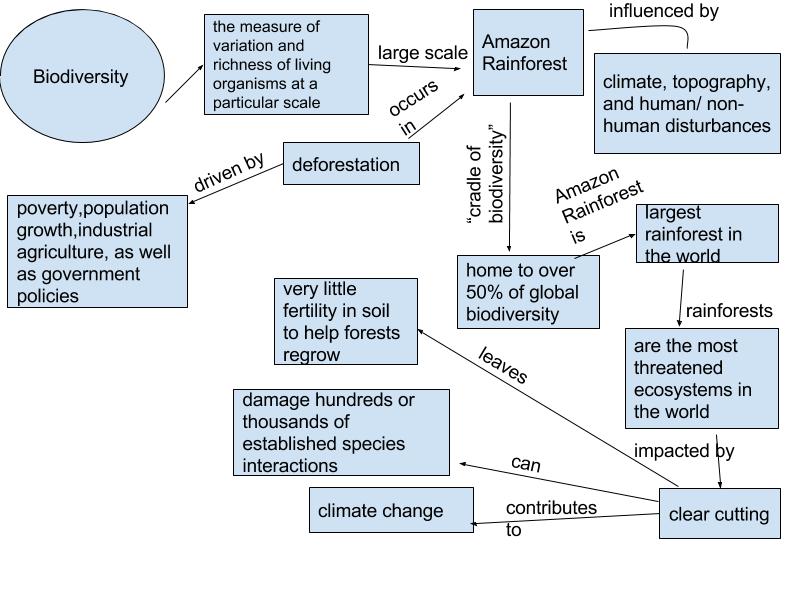
Based on my system diagram, I portrayed the idea of biodiversity within the Amazon Rainforest. Biodiversity is the measure of variation and richness of living organisms at a particular scale, specifically a large scale in the Amazon Rainforest. Being the Amazon Rainforest is the largest rainforest in the world, it is home to about 50% of global biodiversity. However, it is also the most threatened ecosystem in the world because clear cutting impacts it. There is a major problem with clear cutting, as it leads to climate change. Climate change also damages hundreds to thousands of established species interactions since it is very difficult to only damage one, being that thousands of many species live in trees. In the Amazon, population growth and poverty encourage poor farmers to clear new areas of the rainforest. These ideas are exacerbated further from government policies. When these farmers clear parts of the environment, it leaves very less fertile soil left to help rebuild the forest. If deforestation keeps occurring, there will be no rainforests left within about 100 years.
Hi, my name is Avi and I’m a student here at University Park. I thought your system diagram of the Amazon was really interesting. It did a great job of showing the complexity and how much biodiversity there really is there. It also showed the problems like deforestation well.
Here is a link to my model 10 post if you’re interested. https://sites.psu.edu/geog30/wp-admin/post.php?post=58775&action=edi
Hey, I really like your system diagram! You certainly went very in depth on the diagram, and even included some areas of discussion that weren’t included in the module. While I didn’t include a system diagram in my post, we both seemed to focus on the amazon due to its huge amount of biodiversity. I argued that ecocentric values were a more effective way of protecting biodiversity because if all we care about is what we can get out of something we are more likely to exploit it. I also went into some causes of biodiversity loss in my area, as well as some threats to biodiversity in the ocean as a result of ocean acidification. Feel free to check out my post!
http://sites.psu.edu/geog30/2016/04/15/biodiversity-jared-mummert/
Hi, your system graph draws me in. This is a super detailed-depiction on what’s going on in Amazon forests. The graph sets out from biodiversity and explores the impact of clear cutting, and deforestation. I also learned a new fact from your post that the forest would be gone in 100 years if we keep clearing out the forests.In my post I talked about the Colony Collapse Disorder.
http://geog030.dutton.psu.edu/2016/04/15/m10la_wzz5097/