Ian Duchene Biogas in India

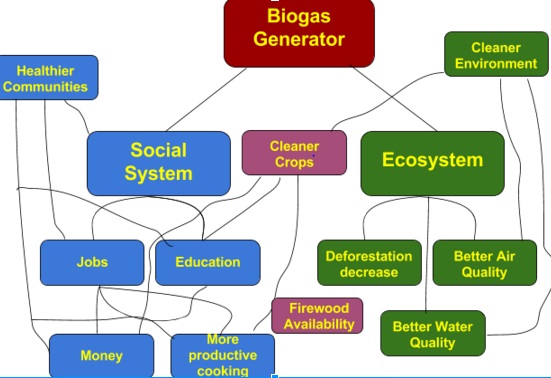
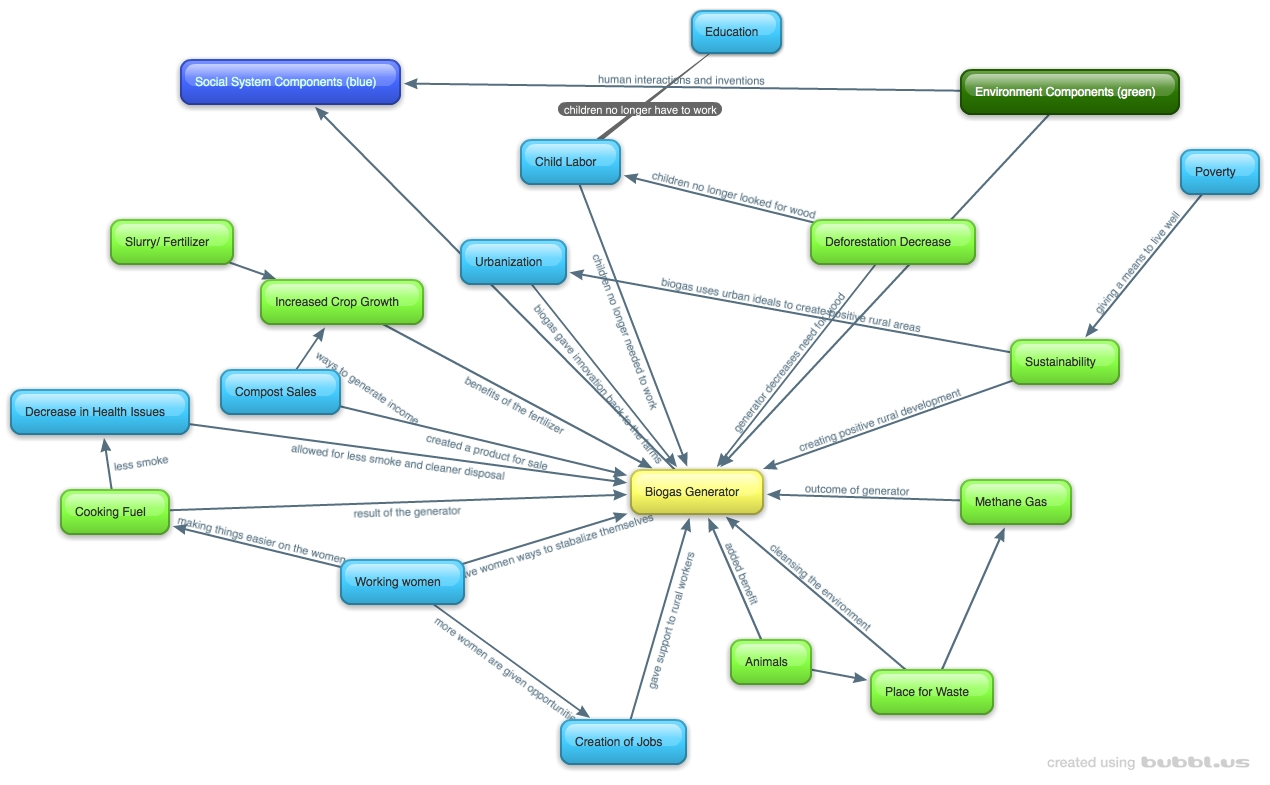
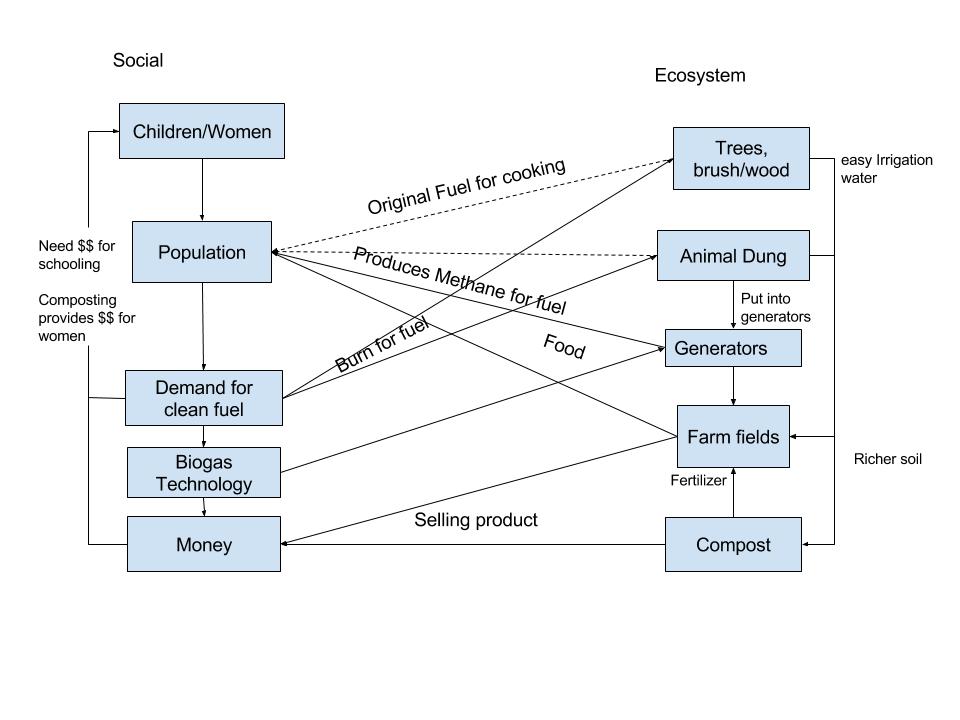
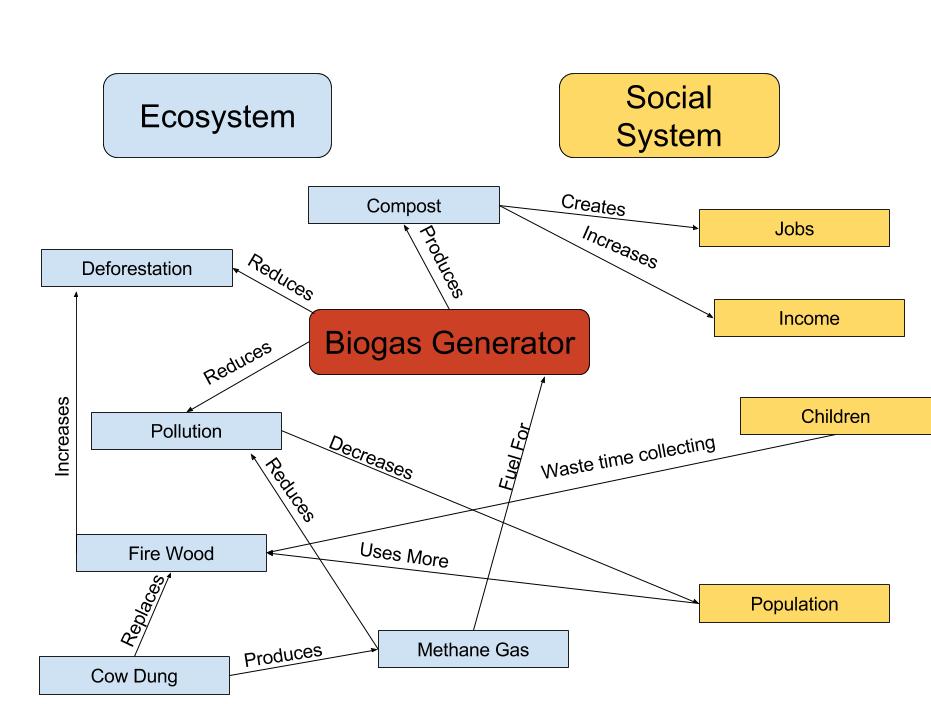
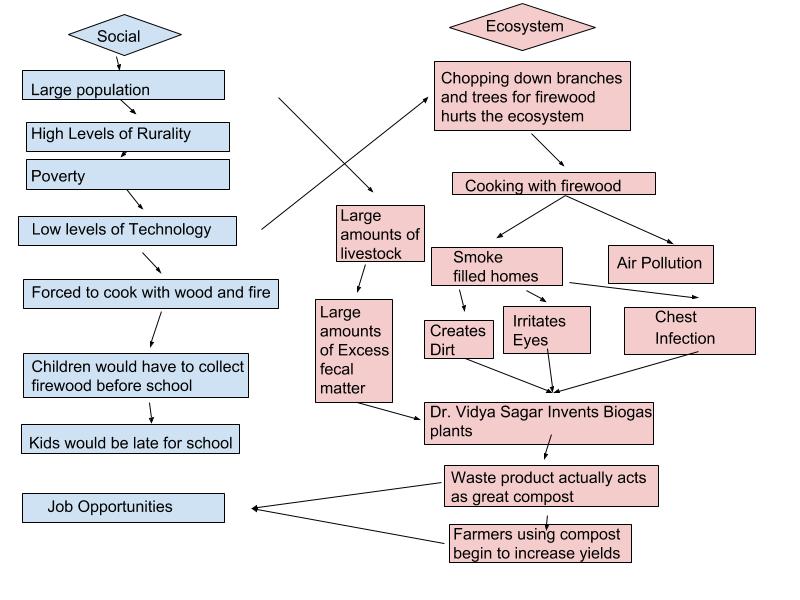
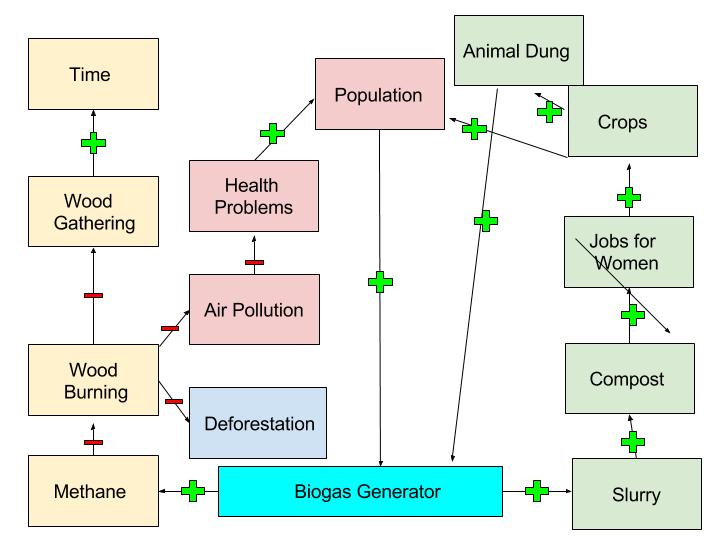
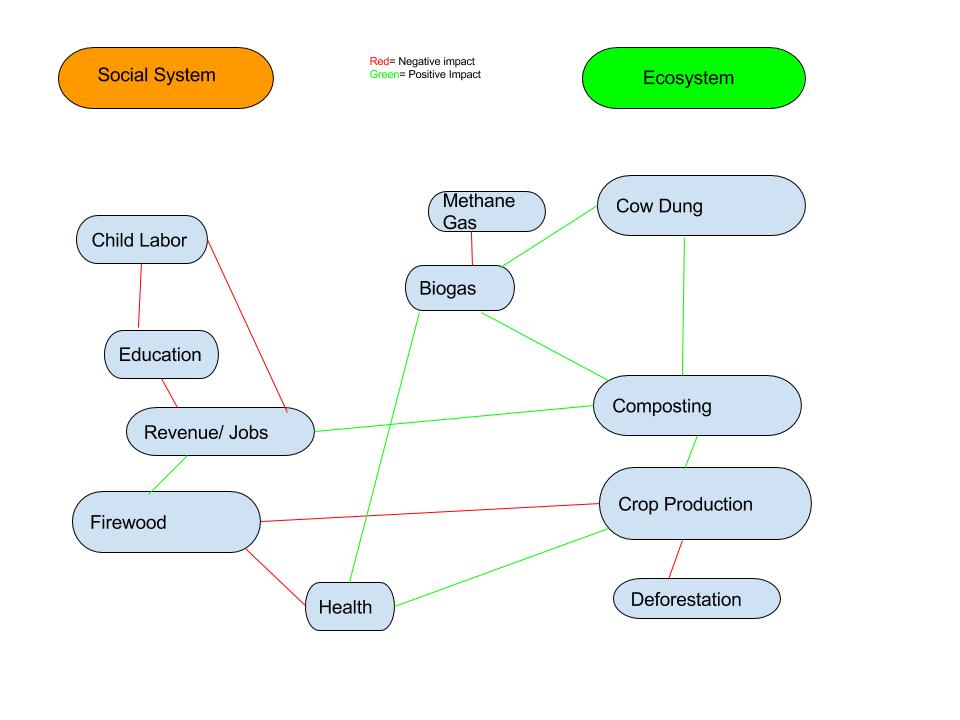
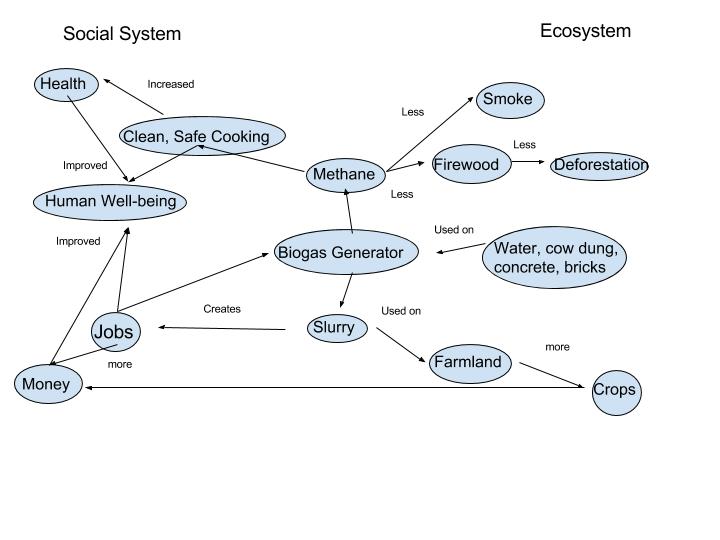
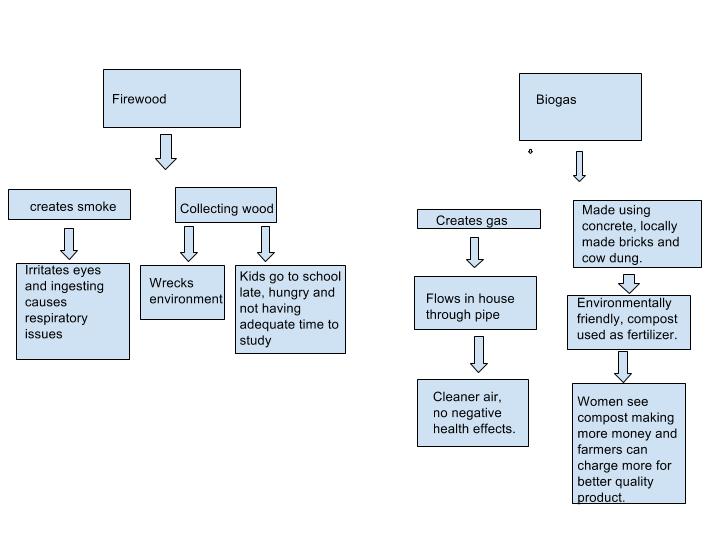
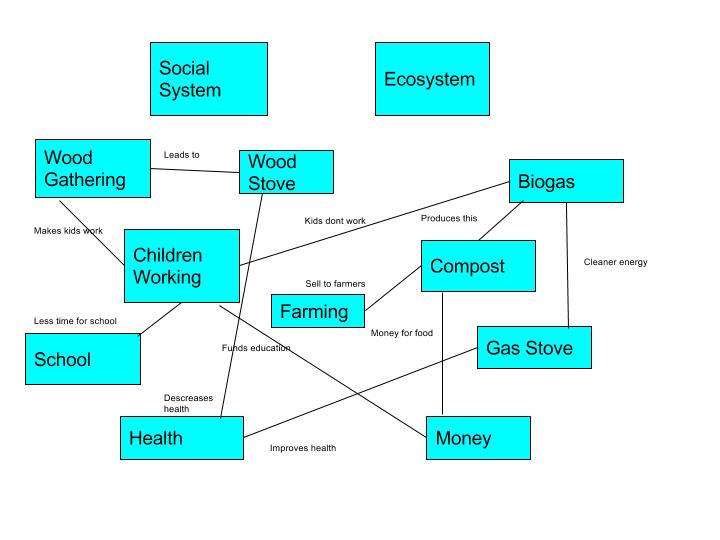
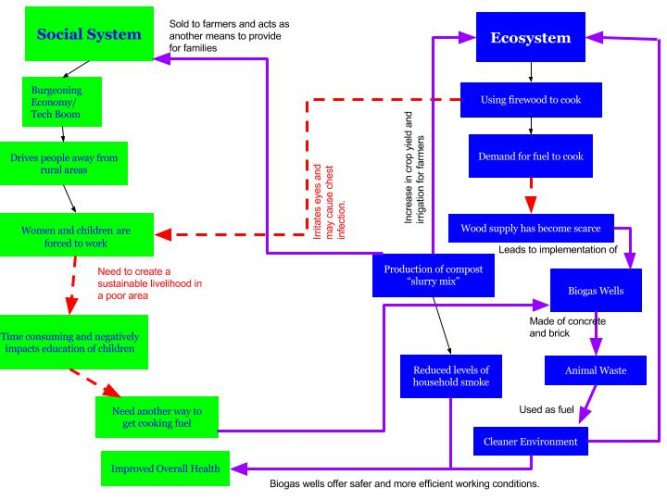
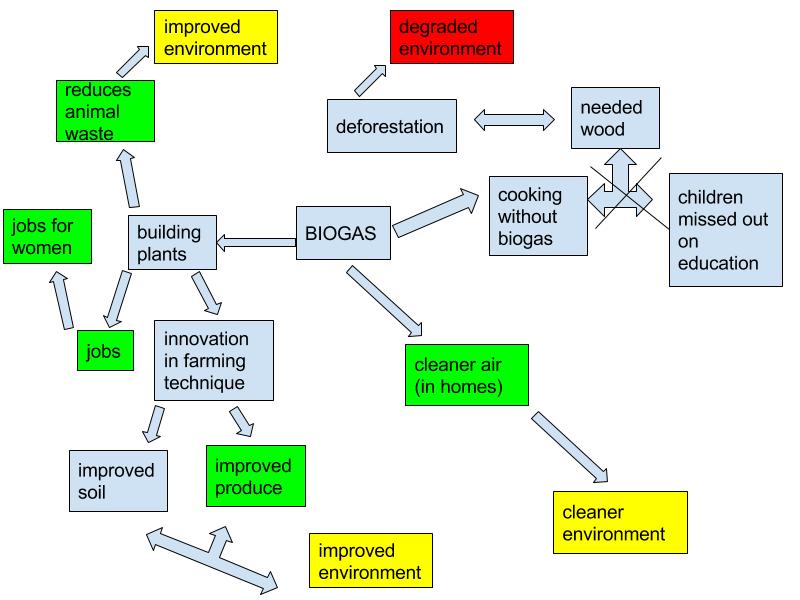
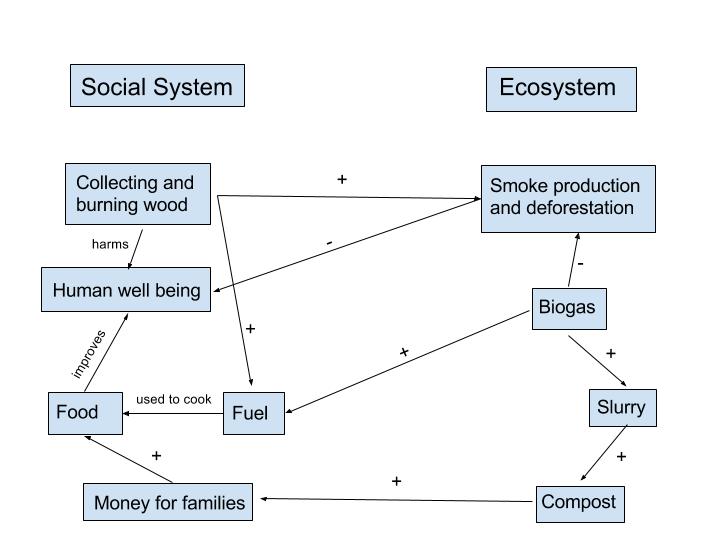
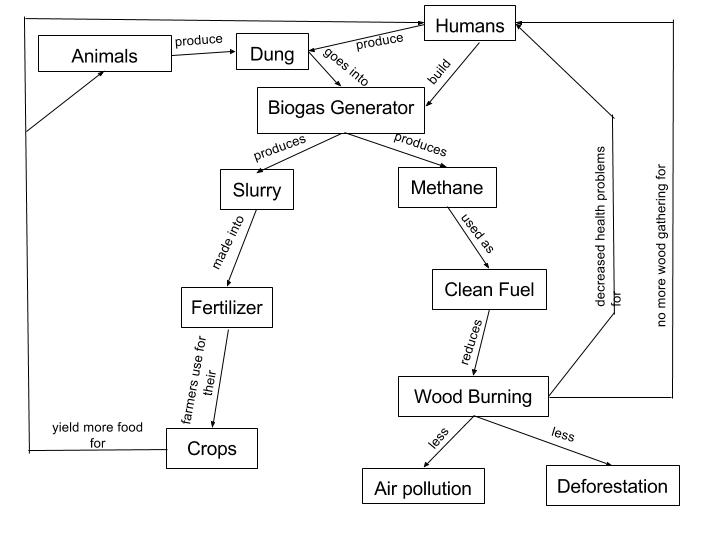
Figure 1 illustrates first all the negative affects (Red) that wood burning stoves have on not only the household but also on the ecosystem in the surrounding rural areas of Bangalore, India. Highlighted in green are the biogas system and the benefits on the local landscape and environment due to the biogas plants. Finally, the economical benefits that are reaped due to the biogas plants are highlighted in purple. From an economic standpoint families have increased financial stability to help afford schooling for the children that were once arriving late and with uncompleted homework assignments. Also, farmers are yielding higher amounts of crops and vegetation increasing the amount of money they bring in. Not to mention the local businesses that are being supported when construction supplies are purchased to build the biogas plants. The ripple effect of benefits that is caused by just one biogas plant is huge on a local landscape. Grounds are cleaner and crops grow healthier. Plus the humans living there are no longer as prone to illnesses. Marten’s diagram differs from mine in the sense that it does not really show the problem that biogas generators are solving. It more or less shows how the biogas plants benefit the landscape. They are similar in the sense that the benefits all fall directly back to the family and the economy nearby. What can be taken from the comparison is that there will always be a demand for the biogas system because the population will continue to grow and if there is decrease in the amount of shrubbery available to burn, the biogas alternative is the best option.

Figure 1. Landscape benefits of Biogas in Bangalore, India.

Figure 1. Landscape benefits of Biogas in Bangalore, India.

Module Two: Biogas Diagram – Tyler Pegarella

BiogasDiag_tzp5145

In this diagram, I am attempting to show the relationship between environmental and personal health. Looking at the overall situation from a systems perspective, one is able to conclude that positive environmental changes will either directly or indirectly lead to healthier people. Through numerous connections, a specific environment may even be able to positively affect global health patterns. Marten’s diagram and mine both show relationships between ecosystems and social systems. Both display the way humans treat ecosystems comes back in the long run. The diagram I created is much more specific, as it focuses on the Biogas revolution in India. Marten’s diagram seems very general and would accurately represent situations in a number of locations.

My diagram also focuses on only positive outcomes, while Marten’s is somewhat seamless in that it doesn’t note negative or positive relationships. This makes it a very strong, typically relatable diagram. Similarly, both diagrams highlight air, water and plants. I find it interesting how Marten was able to incorporate topics like social organization and values, while still maintaining the relationship between social systems and ecosystems. Overall, we want to spread the same message, that the way communities handle the environment does matter. This is especially true in less industrialized nations where day-to-day survival depends on the environment. And while Marten’s diagram is exceptionally well done, mine is more useful in highlighting small, direct relationships in ecosystems and social systems.

Module 2 – Omar Montasser

ovm5033_biogas

In my diagram, I visualized the different components of the village social system and ecosystem and how they interact with each other. Since the village represents a coupled human-environment system, studying it from a systems perspective would lead to a better understanding of the challenges facing it. One of the main ideas that can be inferred from my diagram is that the introduction of biogas generators can help bring a demographic transition to the village. Initially, the population would transition from  high death rates to low death rates as biogas generators reduce smoke and improve population health. Then, the population would transition from high birth rates to low birth rates as biogas generators supply cooking fuel without using wood which reduces the requirement of children to collect wood.
My diagram is similar to Figure 1.5 in “What is Human Ecology?” in some ways. For example, they both portray the general feedback loop of how human population demands cooking fuel which leads to the use of biogas generators and then how biogas generators supply cooking fuel for the population. At the same time, they are different in other ways. For example, Figure 1.5 shows how trees on hills provide farm fields with irrigation water. Also, my figure shows how biogas generators reduce smoke and improve population health. I think these similarities and differences stem from the fact that different scales were used in both diagrams. In other words, my diagram focused on a village near Bangalore, India while Figure 1.5 focused on deforestation in India as a whole. As a result, I think looking at the problem with different scales can help us understand it more thoroughly.

M02: Biogas Generator

Biogas_jys5778


For my system diagram, I decided to take a look at the useful effects the biogas generators could have on society. Through the intake and rotting of human, animal, and plant waste, biogas generators produce a slurry which has two major purposes; production of compost and production of methane gas. The first, production of more compost has been shown to lead to the creation of jobs, mainly for women in India. This is an excellent positive feedback (in this case, positive = good) which has many potential indications. The increase in jobs for women could lead to higher education rates for the generations to come . This, in turn, could lead to newer and more resilient sustainable solutions for energy, agricultural, and social problems. The “?” box is meant to represent to possibility for these solutions, as I see resilience as beneficial in this circumstance. Solutions like the biogas generator have many pros which all improve the standard of living in places where they have been implemented. The second purpose, production of methane gas, is important as it directly benefits the environment. Safe and readily available methane gas allows for people to not have a need to cut down firewood. This reduction in the need for firewood decreases the amount of deforestation happening in the forests. Forests can begin to grow back, and the environment as a whole can begin to thrive again. Marten’s diagram is similar to mine in that several of the components are similiar (soil/compost, technology/biogas generators, plants/animals/environment, etc.) The differences arise from the fact that Marten’s diagram is describing two systems related to each other, mine is describing one.

Biogas System Diagram

Biogas_Diagram_agp5128

In my diagram, I used lines as opposed to arrows to simply show a correlation between the two subjects. The biogas system is a very relevant of a Coupled-Human Environment System that was discoursed in Module 2, where the interactions go beyond what would normally take into account. Much like the figure shown in the reading assignment, my diagram portrays 2 general categories; the Social System, and the Ecosystem. However our diagrams also portray differences, the author takes into account many more factors and correlations. I believe the biggest issue with these systems is the upfront money and resources; which seems to me that most of these communities struggle to come up with. From both of these diagrams, the reader can better apprehend what ties into a composition when both an ecosystem and social system are integrated in the way this biogas generator. I believe it can be well understood that the author and I hold different views, and I can also say that the author is definitely more well-educated on the subject that me. Asides from knowledge on the topic, it can be pretty clear that the theme of these systems also relates heavily to points of view. What I mean by this is that there is no right or wrong answer but rather different perspectives that one may or may not disagree with.

Module 2 – Brian Barnhart

My diagram follows the relationship between the environment and the population of India; focusing on the induction of the biogas generator. It shows that as the population uses wood burning stoves for heat and cooking, harmful byproducts are released. These have an effect on the environment as well as the human population. The diagram goes on to show that the introduction of the biogas generators have had a positive contribution on these same aspects. When compared to Marten’s diagram 1.5, we can see that my model follows a more linear layout while Marten’s shows more specific factors overall. I attempted to give a simplistic, overarching view of these relationships.

GEOG 30 Module 2

Biogas Concept Map- Module 2- Alyssa Gammel

biogas__amg6091

My system diagram depicts the important detail that everything happening is because of these biogas generators and their insertion into the specific environment. I have all of the ideas from the video linking to the biogas generator, in the center. These generators are having such a positive effect on the environment and the social system in India, and I thought it significant to point out this systems perspective and the connections between the components. There are also clear connections between the environment and the social systems. For example, the cooking fuel that is generated from the biogas generator decrease health issues for the people. There is less smoke inhalation and less eye irritants, both, which would cause issues in the future. These biogas generators are so beneficial to the people of India because they were created to aid in the very issues that were present. The creator, being a person from India, understood the perceived issues these rural workingwomen were experiencing. Another positive about the generator, depicted in the diagram, is the constant feedback between all of the components that creates a very stable environment for the people involved and the surrounding biotic factors. However, because this is such new technology, there may be kinks between the components, which could cause times of instability, but in the end, will increase resilience and possibly improve the technology.

My diagram and the diagram in the Marten reading are similar because of the interconnectivity and the basic strong feedback between all of the components. There are biotic and environmental components along with social factors. The Marten system has broader terms in comparison to my system and doesn’t match the centrality of my diagram. Mine has a central point because it was focusing on the biogas generator. The Marten system was the feedback and interconnections between the human ecology, which could explain the broader terms. The differences, again, stem from the different contexts of the systems. Although, it would be possible for the Marten diagram to be explaining the effects of the biogas generator, mine pinpoints the insertion of this technology. Comparing the two diagrams can show that there is more than one way to explain these interconnected components of the environment and the human population. Another outcome is knowing that even the newest technology can fit into the human ecology system that Marten depicted. Overall, there were many similarities and differences between the diagrams: the interconnectivity and the specificity.

Thomas Devenney Learning Activity Module 2

biogas_twd5204My systems diagram proves that the carrying capacity of areas using a biogas system increases by increasing the energy resources (fuel), money, and schooling (opportunities for increased monetary resources in the future) available to the people that work in handling the cow dung, compost, and biogas system itself. It is possible to argue that this systems diagram could represent a positive feedback loop in job creation in the short term for a much larger system, being the Indian rural community as a collective. This could be due not only to the initial jobs that the first biogas systems create, but also the potential jobs that it could create for other rural communities in India that hear about how beneficial the biogas system is and want ones for their own communities. My diagram is similar to the Marten digram in that mine shows how the biogas system affects education, money, health, air pollution, plant growth, and plant preservation. My diagram is different than the Marten diagram in that it does not show how values, social organization, animals, microorganisms, or water are impacted by the biogas system. There are similarities and differences between the two diagrams because this video did not portray possible effects to the topics that I did not include, however, it is more than likely that all of these areas are effected in ways not explained by the video. We can learn from this comparison that not every system affects each of these areas, as each system is different.

Kyle Hoke BioGas System

biogas

The core idea of my diagram is how a large rural population still using old, harmful fire and wood cooking methods led to the birth of the BioGas system shown in the video, and then the positive effects the system has on the social systems of rural India. The system creates a positive feedback loop, as it causes more performances because of its actions. It creates more time for children to gain an education, a clean cooking environment, and more job opportunities for the women that sell the fertilizer that is composted from the leftover slurry. This seems to be a very sustainable system as well, as it leaves more vegetation for the cows to eat (rather than it being used as a cooking fuel) and produce the waste needed to run the system. It is also a very stable system because there is very little to disturb the underground BioGas system. Compared to the diagram in Figure 1.5, they are the same in the way that the population creates a demand and need for the new technology. They are different because my diagram includes the results of the biogas generators, and Figure 1.5 relates the result of cooking fuel right back to the population. The diagram in Figure 1.5 organizes the nodes in ways that creates larger loops so the process can repeat itself. It is good to compare to see not only how an expert analyzes the system, but to see things that may have been missed. For example, the use of animal dung and plant residues not only helps fuel the biogas generators, but it is used for fertilizer too. Therefore, the more that is used in the generators, the less there is to create fertilizer to create healthy farms, although the resulting slurry from the biogas generator helps to create fertilizer as well.

Module 2: Gershom Espinoza

biogas_gbe5025

This diagram illustrates the multiple “links” or feedback mechanisms a human society can have on the natural landscape. Every human activity done on the environment can have positive or negative affects for both systems. For instance, in rural India a longstanding fuel source was wood, which, when used creates ash. Not only are the benefits of wood as fuel few but as time progresses the resiliency and stability of the surrounding habitat of  the area with be critically strained under a bigger demand for resources with a shorter recovery time. The net effect of such ongoing activities means that humans as well as the environment will be progressively worse off. However, with the implementation of a biogas generator, the human populace’s impact on the landscape will be mitigated to a certain degree. By moving away from a linear system (Production-Consumption-Waste) into a closed loop system (Pro.-Cons.-Waste-Pro) the populace is able to maintain or increase their standard of living while at the same time doing the same for the environment because not as many resources are needed. A more important aspect of such a change means that the human populace and environment are better off in the short term as well as the long term (assuming no “drastic changes”).

My diagram was more “illustrative” in how the objects were depicted which may detract from the goal of keeping things as comprehensive and simple as possible amidst all the connections. Also, it was difficult to not include more text captions in the diagram as each effect could be further developed. I could do better at using every niche of space better.

Biogas Mod 2 Blog

In my diagram I constructed a model that represented the process behind the social and environmental systems in India. The human population in India is large and with this is demand for ways to cook food and with the new technology available of biogas, the villages can use renewable resources like cow dung to convert it into a fuel source for preparing food. Considering that India is a poorer country the availability of a free resource is a sustainable key resource to these individuals livelihood. With this technology it gives the mothers time to make money off the compost that farmers use.


My diagram differs from the figure in the reading because the Chinese seem to be burning anything available when the Indian’s seem to be burning only twigs and branches. But our diagrams are alike in that the population of China and India both demand biogas generators and compost. The reason for these similarities and differences are due to the environmental differences and poverty being the similarity between the two cultures. I learned that after looking at my diagram and the diagram displayed in figure 1.5 is that china doesn’t really care for the education of poorer students compared to India’s seemingly demanding importance in the education community.

Biogas_diagram_gsc5075

Learning Activity: Biogas System Diagram

We learned in Module 2 that population has a detrimental impact on the environment. Each area has a certain carrying capacity, so not everyone in that environment will have access to luxury items or items required for survival. In my diagram, I covered the main concepts from the video provided in this module related to both the social system as well as the ecosystem. When comparing my diagram to that of Figure 1.5 from the “What is Human Ecology?”  reading, one can clearly see that Gerry Marten and myself had some similar approaches as well as some differences in our diagrams. I took a more broad approach in my categories, such as “Human Community”, whereas Marten broke it down into “Number of Children”, “Human Population”, and “Need for Labour”; however, each of our diagrams share the same idea as to how the biogas tanks in India are effecting the social system and the ecosystem. Everyone has a different view as to which points in the video were key to the biogas of India, so wee will each have a slightly different diagram of what we see. When comparing my diagram to that of Martens’, one can learn that the biogas has had an impact on the number of jobs, women and children in the population, as well as the markets. One can also see that there are more than just their view on the subject, so there is more than what meets the eye.

Module 2: Coupled Human-Environment Systems

biogas_diagram_kxk5347

The system diagram that I have created demonstrates how the introduction of the Biogas Generator positively impacts the interactions between social systems and ecosystems in India. As my diagram shows, both systems are initially creating problems for the other. When the people of India use wood burning stoves the resilience of the ecosystem is lowered due the need for firewood as fuel. This need is forcing humans out further for already scarce wood, which in turn is damaging the environment and preventing the ecosystem from returning to its initial state. Once the Biogas Generator is introduced into the humans’ social system this issue is eliminated. The people of India now use readily available cow dung as their source of fuel instead of scarce firewood, thus diminishing the destruction of their fragile ecosystem. The diagram also represents other positives of the Biogas Generator, such as an increased source of income as well as increasing agricultural production.

In the reading by Marten Figure 1.5 and my diagram are very similar. In both diagrams not only are the interactions between the two systems represented, but the the interactions within each system are also represented. A difference among the two diagrams is shown in the author’s portrayal of cause and effect. In Figure 1.5 a positive feedback loop shows how the demand for cooking fuel increases the number of children, thus increasing the population and increasing the need for cooking fuel. My diagram is simpler by showing how a change in one system can either benefit or hurt the other system. There are similarities and differences in the diagrams due to given information and author interpretation. Both diagrams have similar structures because they were given the same information, but differ due to each author having a different direction of focus. By comparing the two diagrams we learn that there are multiple ways to analyze given information and focusing on different aspects of a system can alter the product produced.


Biogas Generation System- Neil Karmaker

module_2_biogas_diagram_nqk5110

The core ideas behind the diagram include the explicit social system and ecosystem impacts that are achieved with the introduction of the biogas system in different landscapes.  There are so many benefits that the biogas system brings to the landscape they are introduced in, such as the cleaner fuel, reduced health effects, improved crop production, increased education rates, and the increase in jobs in communities that adopt this system. The previous system that was done using firewood, had many negative drawbacks, but the system diagram presented the direct improvements on those drawbacks, and also included different benefits that the biogas system introduced. With the systems diagram, it is easy to identify some beneficial positive feedback loops. For example, with improved crop yield, communities are able to raise more cows and livestock, which then produce the waste that creates slurry, that fuels the entire biogas process and makes the loop grow larger. This biogas system also affects the impact to the environment in the local area (IPAT). On the local community scale, the population and the affluence are not going the necessarily change with the introduction of this biogas system, but the technological aspect will definitely be reduced due to all of the benefits this system brings in terms of upkeep of the environment and the people living there, and the economic systems that drive the landscape to stability. In comparison to Figure 1.5, my diagram may be a little bit more convoluted and is most likely more difficult to read. In Figure 1.5, the diagram is clearly split into two distinct categories, social system and ecosystem, whereas in mine, there is a split, but I think it is more difficult to see. I think they are similar in the trend in organization, where I chose to attempt to categorize all of the information related to social system and ecosystems, and have the arrows connecting between the two systems. I think the similarities and differences arise solely from the categorization, and the subject matter, respectively.

Ryan Gebhardt Module 2

Biogas is a very good example of an idea that contributes to a symbiotic relationship between humans and nature. On each side of my diagram is the ecosystem and the Social System and its components related to each of them. In the design of my diagram I tried to show Biogas as the driving force of its many positive impacts, some of which also branch off and have further effects on the system. While biogas’ immediate purpose might be to lower human effort in collecting firewood and produce less harmful gases from stoves, through its byproducts the women of the village were able to provide a living for themselves producing and selling organic compost. And from this compost, farmers produced higher yields of higher quality crops which benefits the local people and economy greatly.

When comparing my diagram to Gerry Marten’s figure 1.5 in “Human Ecology,” I notice we have some similarities and differences. I would say Gerry’s figure includes a lot of similar ideas to mine, including the production of compost and the decrease in deforestation. However we differ in some areas, especially on the social system-side. I chose to include farmers on the social-side due to the primarily human impact it has. He also doesn’t include the economic impact of the situation, like how the local women were making a living and farmers were earning more from their crops. We seem to have differences because he focused more on the broader implications of this product while I focused more on the specific impacts it makes to the people involved. From comparison of the two designs I believe it makes it clear there are always more angles to look at issues than we might imagine.

Module 2 Biogas_rpg5121

Biogas Generating System -Ralph Diaz

rad5402 (500x375)

My system diagram includes many social and environmental impacts of the biogas generator. Each line indicates one idea is directly impacting the next. I did not differentiate the social and environmental parts of this diagram because they are highly interconnected. One really interesting component that I did not include in this chart is the positive feedback loop this biogas generator model is creating: as villagers are seeing the impact of this biogas generator, they are likely to want one themselves, and this creates a positive feedback loop concerning the demand of this generator. Small household units like this are self sustainable and can have large impacts on carrying capacity of the land.

The main difference between my system diagram and the example in figure 1.5 is the immediacy of impacts. The example has many impacts shown that may take years or decades to manifest, but I largely included immediate, noticeable impacts (typically things that would be noticed within a single year). Between my model and figure 1.5, the interconnection is well preserved. Both models demonstrate that each of these impacts are related in some way. I believe the main source of the differences in these two diagrams are that the writer of the example diagram and I have slightly different views. I tend to view things in what can be immediately shown or proven while the writer of the example also views things concerning potential long-term impacts. This comparison can teach us how differently we can view environmental matters and the impact of specific items in our lives.

Module 2

biogas_jmw5890

In the diagram I created, I illustrated the relationship between the social system of the Indian village and the ecosystem surrounding them. Using the arrows to help label usage and direction, the illustration shows the demand for fuel and what is affected in the environment in relation as well as a solution. The presence of humans in this particular area has disrupted the natural flow of the environment. For example, the need for fuel caused the villagers to chop down trees and bushes to gather wood to burn which in turn created the problem of deforestation leading to the demand for an alternative fuel leading to animal dung and basically anything that they could burn. It was when biogas technology was created and put into effect using generators that utilized animal dung to create methane that an alternative fuel was found. Methane proved to be that solution of clean fuel which benefited everyone in the end considering the mixture could be made into fertilizer that women sold to farmers to make money for school and the farmers used to grow crops.

Compared to the diagram in the reading, my illustration is rather similar. It would seem I used the same layout that the author used in the reading with the stacked square boxes and arrow lines to signify relationships.

The main difference I see is that I added money into the equation considering money was an issue for the villagers and specifically the women that were looking to send themselves and children to school. The compost was stated to be the money maker in the video that women were able to sell the rich soil to farmers for a profit.

One could say the similarities stem from the fact that the same information was presented to the authors of both diagrams. On the other hand, differences from different thought processes and interpretation of the information.

Need creates demand which pushes motivation to progress an economy. This village is now generating revenue from sales of compost and creating an efficient source of fuel.

Module Two Learning Activity: Johnna Puhr

Untitled document

The core ideas behind my diagram is to show the environmental and social effects of the Biogas generator. As we learned in module two, the system works as a human- environment system as most systems we see every day do. The diagram has both negative and positive feedback loops. An example of a positive feedback loop is the overgrowing population has a source of food from the farms. The effects overall benefit the social system and ecosystem. The population can now use Biogas as a source of fuel, in which helps the ecosystem by the reduction of cutting down trees. With this technology India can accumulate a greater resilience meaning that disturbances such as a population spike won’t cause huge problems. As you can see from my diagram firewood creates pollution from smoke which has a negative effect on the population. The introduction of the biogas generator decreases the environmental impact and lessens the health effects on the population.


My diagram is very similar to the one in the Marten reading. Most of the similarities lie under the ecosystem side. Both diagrams have the concept of the biogas generator, farming fields for food. The differences between Figure 1.5 in the Marten reading and my diagram is that I consider the pollution effects from smoke from the firewood. I also consider the fact that children will be missing school to collect wood to burn. This diagram was also difficult for me to make. Mine is harder to read than the one in the reading. The two diagrams are different because everyone interprets the information differently. Something I put on my diagram someone else might not think of. I may have focused my diagram on different aspects than the one in the reading causing them to be different. What we can learn by these different comparisons between the two diagrams is that everyone interprets information in their own way.

Module 2 – Kelsey Shoepe

kms6527- Mod 2 Chart

Some of the core ideas behind my diagram are the cause and affects that the biogas tank had on the ecosystem and the social system of India. I tried to have this chart display the positive and the negative affects of this new technology. As an example you can see in the Social System part of the chart that the “Use of Methane Gas” impacts more then one of the social system criteria. By using this gas the people in India are able to reduce the amount of wood they are using which in turn improves the quality of life and creates educational opportunities for people. From my understanding I thought of this as a negative feedback loop. This is because under this circumstance the action that is being performed will eventually being familiar to people which hopefully create less steps to follow to use the biogas tank and even the steps to build new ones. This entire chart is also an example of a human-environment system. This is because (looking at the chart) we are treating the environment and what is happening to it as a system on its own and then you can look at the human system and the people using the biogas tank as a completely separate system.

Looking at Figure 1.5 there are similarities in our charts right away. You can see that Marten also broke up his chart into two main sections with the Social System and the Ecosystem. There are also slight similarities in what each of those charts consists of. However the differences would have to be that Marten used more broad terms and concepts when labeling his charts whereas I used specific terms and phrases from the video. There are similarities and differences because I made my chart based on the video where Marten did not. Through my model you are able to see the benefits that the biogas tank has on the villages that use them and how it is changing the lives of many in India.

Chase Sandler Learning Activity 2

Untitled document

When designing my diagram I took into account many different methods within the systems perspective area based off of this module. I analyzed the different effects and results that both the Ecosystem and Social System would undergo as a result of this biogas in India. So when deciding how the different components of each system interact, I had to take a few things into account.

As for the Social System, I chose to include who was going to be effected by the biogas. Next I stated how each example would specifically be effected, good or bad. After that, I went on to the Ecosystem and analyzed how the video stated that this would be affected. I broke down the category into three main groups and went on to give the best examples of what types of changes would actually occur.

My diagram is both similar and different to that of Gerald Martin. Both of our diagrams give an overall perspective of how the Environment System would be affected by the biogas usage in India. We both focus on results on the actual population in terms of health benefits and disease reduction. While his diagram focuses a lot into the population affects, mine gives an overall view of what will happen. Both diagrams do a great job, in my opinion, of portraying this Human Environment (Social) System.

Module 2: Eric Acosta

Biogas_exa5162

The diagram explains the benefits of the Biogas Generator, both for the ecosystem and the social system. It shows the Human-Environment System in a visual form. The society explained in the video used firewood as their main source of fuel for cooking. Burning firewood increased pollution and also increased deforestation. The diagram above shows how the Biogas Generator removed burning firewood by using cow dung to produce methane gas which fueled the generator. Burning methane gas creates much less pollution than burning firewood does. The decrease in the use firewood slows down the deforestation in the area which impacts the ecosystem drastically. The generator also produces compost. People then sold the produced compost which increased their incomes and also created more jobs for compost sellers.

My diagram and the diagram given by Gerald Martin have many similarities and differences. For one thing, both of our diagrams show how the Biogas Generator affects the Human-Environment System in the Indian society. A difference between our diagrams is that he included how the generator affects farm fields. My diagram leaned more toward pollution and how the generator reduced it while his diagram leaned more toward the population aspect of the system. There are similarities because there are many ways to look at the situation and not one of them is more correct than the other. Whether you look at my diagram or Martin’s, you will still get information on how the Biogas Generator affects the Human-Environment System.

Module 2 Post- Jake Hughes


My core ideas behind my design are fully developed around the ecosystem and the social system within Biogas itself. My chart incorporates wood helping the kids of Biogas with the smoke and the attendance. The ecosystem is benefitted in several ways as well. The decrease in pollution and deforestation decrease will both aid in ecosystem preservation. The methane gas provides families with clean cooking gas and many health benefits through the use of better soil to strengthen the crops and in-turn resulting in healthier animals. The graph shows the stability within Biogas by eliminating the depleting resource of wood. Wood is finite but the human waste to provide the gas will not be. This process of methane creation will provide sustainability within Biogas and increase health factors within the ecosystem and the social system.

Compared to the diagram in Figure 1.5 of the Marten reading, “What is Human Ecology”, my diagram looks similar and different. The similarities include the representation of the social system and the ecosystem alike. My diagram, however, is much more linear and easy to follow than this one is. My diagram flows straight through with the exception of human waste at the end. The model in Figure 1.5 is much more complex. The relationship between the subgroups of the social system and the ecosystem are far more intricate than mine. These similarities and differences are because of the lack of information in the 5-minute video. The tress and shrubs on the hill wouldn’t have been picked up from the small amount of information. The health benefits from my graph and the irrigation would both be things that we could learn from these charts.


https://docs.google.com/document/d/1_odsulwfDuKDmcqmRx0nB7OFjhhByLgGPvA69YHlhE8/edit?usp=sharing


David Youn

In Gerry Marten’s “What is Human Ecology”, he illustrates the relationship between the social system and the ecosystem. He demonstrates that increase in population increases the amount of cooking fuel. This eventually leads to deforestation. Deforestation is an issue because the Earth only provides limited amount of fire woods. Similar to his figure, my figure mainly demonstrates the same idea that we need fire woods to fuel the fire to produce edible food. However, I have added some details that he have left out in the diagram. One of my core idea is that biogas generator have given women in India to start a business by selling the compost to the farmers. The farmers would than produce food that humans can consume. This causes an feedback loop in which they save the environment and increase profit. In other words, there would not be any waste created in this type of system. Initially, this causes a positive feedback because the integration of biogas generator in the society leads the women to do more work by selling the compost to the farmers. Furthermore, I believe that Marten left out a crucial information in his entry. He has left out the fact that the children who are helping their parents collect the fire wood is losing time on education. This is an incredibly important factor in any social system because children are the people who will eventually lead the next generation of people. There are differences in the two figures because many people think differently and value certain ideas more over other. We can learn from these comparisons that, we need many other view points because it is easy for others to forget certain aspects that might be important to the society.  hxy5072

Module 2 Jonah Kim

Module 2 Biogas Plant

As we learned in the module a large population will have a large effect on the environment. This is evident in India, where the country has such a large population so not everyone can fit inside the modern, technology centered cities. So they have to cook with fire and wood. Because of this children would have to collect firewood before school so their mothers could cook. This caused many kids in rural areas to be late or even entirely miss school and miss out on their studies. On the other hand in the ecosystemthe kids and mothers chopping down trees and hurting the ecosystem. Then with the wood fires children and mothers would negatively affect health. So Dr. Vidya Sagar realized he could take the excess cow manure to create a biogas plant. Another benefit is that the remaining product acts as a very good compost and so women who use gas stoves and biogas plants can also make money selling the remains for compost. So like in “What Are You Optimistic About? Why?” by Ray Kurzwell, technology could evolve to help reduce impact. My diagram is similar to Marten’s diagram through the content. Everything he’s talking about I talk about as well just more specifically in each square. I, however, do not have as many connections between social and ecosystems. It could be learned that their are a lot more connections between a social system and an ecosystem than we may initially think.

Module 2: Biogas –Samantha Luchansky

Biogas_srl5262

Above is a biogas diagram based on the 5minute video discussing biogas in India. The diagram displays how the introduction of biogas to India effected the social and ecological systems present there. The systems overlap each other, with similar causes which produce different effects. Some of the effects within one system result in benefits for the other system (better animals and food for the social system to cook and eat). Overall there is a symbiotic relationship between the two and as a whole the introduction of biogas has had a positive effect. The effects of the social and ecosystems involve health benefits (identified in the diagram), along with agricultural improvements (soil, crops, animal, and decreased pollution/deforestation), and educational/social growth (less time spent gathering wood, kids not late for class). There is a kind of relationship in which A impacts B and B impacts A in an ever evolving circle. Improvement in the social system leads to better education and increased environmental protection and ideas, which causes improvement in crops, soil, pollution rates, etc. This outcome allows for more health benefits, resources, and better quality food for the social system to use. Gerald G. Marten created a biogas diagram of his own in his book What is Human Ecology? When comparing Marten’s diagram to my own it can be seen that he is focusing more on the “big picture” issues like (human population, demand for fuel, biogas generators-how they would get into villages) whereas my diagram is more specific and not as over reaching. Marten shows the idea of systems passing energy, material, and information between each other. My diagram focuses more on the connection between social and ecosystem and not the broader view/idea Marten chose. The two are most likely different because we are different people with different ideas on how to organize and interpret the information given to us. Both address the connection between systems and the effects biogas has on the community.

jzd5496_SystemDiagram


Dodderer_Biogas

The system diagram above conveys the Human-Environment System by displaying the vast interactions of the social system and ecosystem within the biogas revolution in India. The diagram shows both the positive and negative impacts of the technological development of biogas culture. The wood burning culture had created poor health effects due to wood burning, it forced child labor for collecting firewood, and caused deforestation. The new biogas culture allowed for a cleaner environment, less health effects, and less deforestation. It also created new jobs and wealth which allows the human population to flourish.

In comparison with the Marten system diagram there are similarities and differences. Both the Marten diagram and my own showcase the various interactions of the Human-Environment system. They display the affects that human decisions have on the environment and the way the environment affects human decision making. They differ in that Marten has more specific cross interactions between the two. Mine could have used more wording in the cross between to be more complete. I think these similarities and differences help to showcase where one puts emphasis on certain decisions and where others may be overlooked. I think it is important for things to be analyzed from more than one perspective so that we get a more complete picture of the interactions from a research perspective.

Module 2: Effect of Biogas Generators

GEOG 030: Module 2: Coupled Human-Environment Activities
The diagram included below examines the interaction of various components of an ecosystem which is exposed to new technology and the effects of positive feedback on the lives of villagers who have access to that new technology. The positive feedback results from the improvements in the type of fuel used for cooking, generated biogas as opposed to harvested wood and other forms of “burnable” materials. The decreased use of wood, allows the increased growth of trees and vegetation, reducing destructive deforestation. This, in turn permits increased retention of ground water and therefore more fertile fields with better crop yield. All of this results in a more stable, resilient, sustainable ecosystem. Resultant outputs of this new technology are a reduction in pollution, improved health of the villagers, less need for children to scavenge for fuel which allows them more time for education, and by-product compost which can be sold to improve the economic standing of the villagers who have more income with which to improve their education and lives. My diagram focuses solely on the processes of the human – environment activities without much differentiation between the social system and the ecosystem. The Marten diagram does more to categorize these activities by placing them on opposite sides of the diagram, therefore visually displaying the amount interaction inside each system and also between the two systems. It would be interesting to be able to measure the overall, collective effect of all of these biogas generators in terms of the IPAT equation for the country.GEOG 030 Biogas Diagram mae(2)

Module 2 BioGas Social and Economic Linkages


Untitled document

Entering into this I tried not to make any gross assumptions about the cultural expectations or the propensity for industrialization for the population that was discussed in the video given it was only five minutes long, which is why I wanted to keep it simpler.

So the BioGas Generator plant has positive feedback, as discussed in the video it has many different positive effects, such as the slush that produces the high quality compost which increases the productivity of their farming which in turn assuming that their farming will eventually move away from being subsistent to becoming commercial and being able to increase their overall financial well being. That is assuming it does not become communal and also assuming the increase in productivity of the farming is substantial enough to become financially productive.

The one part I thought was the most interesting, was the effect on the personal health, which I think has a lot of effect on the personal well being of a less modernized culture, this is also taking I think a slightly extreme view on the effect on their health. Looking at the overall positive effect on their personal health and assume an absolute of just a net positive, assume their families can become bigger, a longer lifespan, longer effective working ages, it becomes a large net positive which leads to overall in a farming community an increase in the production from the farm and like discussed earlier increased production of the farm leads to increased financial stability.

The last part which is where my discussion may get a little bit cynical and takes a bit from another class I’m in which I found interesting, is the combination of deforestation and the effects of the increased financials. The initial effect of the Biogas generator is a decrease in overall deforestation locally because it requires less overall use of wood fire stoves. However, the final effect may lead to more deforestation, the effect of being able to afford more, say afford an education and eventually with education and expansion comes the building of homes and purchasing of cars. The building of homes and the luxury of cars, (I will call it a luxury compared to them because they currently are getting by based solely on the video without them) leads to more deforestation. It may be a bit extreme, but it is assumptions in absolutes, and significantly long term results overall.

Module 2- Joelle Marino

biogas_jem5810

The main idea that my diagram illustrates is how a small village is impacted by a biogas generator. Through my diagram, one can see that the biogas generator gives off two different products, methane and slurry. Each product has a major impact on different aspects of every day life. Through the production of methane, there is a decrease of wood burning which leads to a decrease in wood gathering, air pollution and deforestation. With the decrease in wood gathering, there is an increase in time that the occupants of these villages have. The children have more time to go to school and do their homework and women have more time to work. With the decrease in air pollution, there is a decrease in health problems and an increase in population. Since there is an increase in population, more people are able to move to the city and help make biogas generators. With the production of slurry from the generator, there is more compost being created. With this compost, women are able to package it and sell it to farmers. with this compost, the farmers are able to grow more crops. Since farmers are able to grow more crops there is an increase in the population. Also a product of the crops is more animal dung, which fuels the biogas generators.


Looking at the Marten model of biofuel generators in India I see some similarities but many differences. When looking at Marten’s model, I can see that we both connect some points on each side to one another, as well as to the biogas generators.We both describe how it leads back to the generator. While we both describe it, we do it in different ways. I take the path of the products that come from the generators while he physically separates them into the social and ecosystems. In his model, Marten uses words to describe what is happening between each of the examples. In my model, I use plus and minus symbols to describe a positive and negative feedback look. The organization of each can lead to different outlooks on each model. From the comparison, one can see how exactly one leads to another through the words on the Marten model. It’s easy to see and learn about the impacts on each system through each of the models. Although it’s not explicitly labelled on my model, the social system and ecosystem are laid out in the exact same ways. Through these models, we can see the benefits the biogas generator has on each village and how it is set out to change life in India.

Module II: Biogas in India

Module II- Biogas System

In my diagram I used systems perspective to show linkages of positive and negative outputs from the two different fuel systems discussed in the video. I wanted my diagram to show the chain of effects that occur when people consume natural resources and when new technology is introduced into the ecosystem. For example, we were told how the wood burning stove was creating a recursive relationship. Although burning wood was vital for the villagers, it was causing deforestation. Deforestation affects the biota factor, structure, and organic matter in soil. These changes in the soil affect crop yield and runoff which ultimately affects the stability of both the ecosystem and social system. These degrading conditions were creating a humanized environment which was not sustainable for India. In the diagram I created, I used red boxes to represent the old system and its negative impacts on the village people and ecosystem. The green boxes were used to introduce the new sustainable system which caused a positive feedback loop. I increased the size and boldness of the font of my main ideas and used curved arrows to show linkage. When comparing my diagram to Figure 1.5 “What is Human Ecology?” I noticed a few similarities and many differences. We both separated the two main ideas of the biogas technology. We also used arrows to show the causes and effects from the different systems. Marten did not use any color in his diagram and he also used dashed lines to show correlations. By comparing the two diagrams, I realized how much information a diagram can hold, if properly organized. In the future, I might take a different approach when creating a diagram. If everything is organized and easy to follow, it’s much more understandable and desirable for viewers. Comparing the diagrams also showed how different and diverse our individual perspectives can be when interpreting human-environment interactions.

Module 2 Activity – Katie Greiner

The system diagram below depicts the relationship between the ecosystem and social system in Karnataka, India after a Biogas Generator was put to use in the town. The diagram demonstrates the impact that the two system perspectives, the human system and environmental system, have on each other. The ecosystem column displays the environmental system while the social system depicts the human system. These two systems create something called a feedback loop, which means that impact to the environmental system has an impact on the human system and vice versa. The benefits of the Biogas Generators has  created a positive impact on both the environmental system and the human system in Karnataka. In the reading, What is Human Ecology?,there is a diagram titled, “Cooking Fuel and the Deforestation in India.” This system diagram is similar to the diagram below in that they both have the same underlying concept of Biogas Generators as a source of cooking fuel. Both diagrams contain information about how Biogas Generators have or will have an impact on both the environmental system and human system in India. Both diagrams also discuss what the  Biogas Generators produce, for example methane gas and compost. Even though both diagrams have similar components, the diagrams still differ. The diagram in What is Human Ecology? human system (social system) focuses more on how the population and the populations needs. The diagram below focuses more on the benefits of the Biogas Generator and how it is improving the quality of life among the social system. In comparing these two diagrams, together they can show us the needs of the human system along with the benefits the Biogas Generators will have on the social system. By separating these diagrams, the reader may not understand why the people in certain regions of India need a Biogas Generator to improve their social system along with their environmental system.

kmg5849

I used a couple key concepts from module 2 to help me construct this system diagram. Biogas production in rural India affects the people and environment there in many ways.  Utilizing the biogas generator utilizes technology to increase the carrying capacity of the system.  When using exclusively firewood for fuel, the people had one resource that could be depleted.  Technology allows people to use a waste product to increase the available fuel for cooking and heat.   I highlighted the biogas generator in a different color because it is the main driver of change in this example.  Once biogas generation is possible, Firewood collection is reduced and people spend less time gathering it.  Fuel is produced from the generator which reduces the polluting smoke of firewood, and gives people an efficient form of energy.  The generator also produces usable nutrients which reduces pollution to the environment and produces income.  The nutrients also boost agricultural production which again gives people income and more food.  The addition of the generator to the system increases the stability of the system because there are fewer inflows and out flows.  My diagram is similar to Marten’s in that there are two main interaction categories of humans and the environment.  My diagram is different because it is more focused on the effect of the generator than the overall cycle.  There are similarities because the purpose of the biogas generator is to effect the dynamics of the social-environmental system.  It shows that these are complex systems and it is hard for a systems diagram to simplify it to just a couple interactions.

Untitled drawing


Module 2: Biogas Diagram

BiogasDiagram2_AdamAbbott

With my diagram on the social system of the village with the ecosystem around the village I am trying to demonstrate how the actions of the village change the ecosystem around them which also forces the village to change in return. This is an example of a human-environment coupling. The people in the village rely on wood to fuel their stoves to cook food. Unfortunately, there is not an overabundance of wood in India. Because of this the people in the village were exhausting the resources of the wood. My diagram demonstrates this as well as the effect it has on the children not being able to attend school due to workers being needed to collect the wood. The diagram goes on to show that because of reduced home air quality, thanks to the overuse of wood, a new fuel source for cooking was needed. The creation of the biogas tanks creates a full circle effect. Thanks to the impact of wood fueled cooking, biogas was incorporated so that the impact of wood consumption could decrease. What my diagram does not quite cover is the feedback loop that exists because of this. There is one slightly demonstrated in that with the creation of biogas the use of wood decreases and then also leads to more jobs and more schooling for the kids. What was not explored in the video or this diagram is the potential effect the biogas slurry dumping can have on the environment. If the slurry is not properly disposed another whole cycle begins which would potentially lead to yet another fuel source being needed for cooking. This is a great example of a feedback cycle as it is always constantly going back and forth between social and environmental issues.

My diagram is similar to that of Gerry Marten’s in that it addresses the social system and ecosystem have a feedback loop and are constantly effecting each other. His diagram goes more in depth though by showing smaller levels of impact like microorganisms, which do play a part in the biogas solution as well through the creation of compost that can be the habitat of worms. There are similarities and differences because everyone’s view on how the social aspect of humans and the ecosystem aspect of the environment affect each other, but the most views on these issues come from the same core ideas which will always lead to similarity.

Biogas- Dustin Welch

Biogas_dww5310

The intent of this diagram is to show the social and environmental effects of the Biogas Generator in India. The Biogas generators have improved the quality of life of some of the poorest people in the country. The use of cow dung helps keep the country side clean, while also providing the necessary element of the Biogas generator. The methane produced from the dung/water slurry mixture is used as a clean energy source for cooking and heating. Before the generators, firewood would have been used. The smoke was detrimental to the people’s health, increased deforestation, and children missed out on educational opportunities because they were working. An added side effect of the slurry mixture is its use in composting. Women especially have been able raise revenue through the sale of the nutrient rich compost mixture. The impact that the booming population has had on the ecosystem is a driving force behind the Biogas Generators.

There are a few similarities and differences between my diagram and figure 1.5 in the Marten reading. They are similar in that they both showcase the cross-interaction between the social system and the ecosystem. The methane gas that is produced leads to less deforestation and increased health benefits by improving air quality. A major difference is that Marten’s diagram is much more detailed, highlighting some of the smaller catalysts within the system.

Module 2: Biogas Diagram – Dylan Hellings

The 5 minute video about biogas in India focused a lot on how their society has been negatively impacted before biogas. My diagram focuses primarily on how biogas has benefited their society and their surrounding environment, as they form a symbiotic relationship – one affecting the other. Before biogas, collecting wood can lead to deforestation in the ecosystem, this is a big disturbance of the system which affects the stability of both systems. All of the causes and effects act on each other, both from the different systems, ecosystem and social system, and within their systems themselves. The primary points being benefits to health, productivity, nature and social growth. With the development of biogas, the society is able to grow, with society growing they can treat the environment better which results in better health and resources for the society. It is very relevant that “A impacts B.”

Marten’s diagram similarly shows the benefits to the social system and ecosystem, although displayed in a different way. In my diagram I focused more on the specific outcomes of using biogas while Marten is taking a look at the bigger picture. My diagram implies a lot of what it is in Marten’s diagram. My diagram shows specifically how there is an interconnectedness between the social system and the ecosystem while Marten takes a more broad approach in saying “Ecosystem Services: Energy, Material, Information”. I don’t know if I would agree that either diagram teaches more, but that they take a different approach – a more specific sense versus a broad overlooking approach.

Biogas-dsh5258

Rob Hudert – Biogas System Diagram

Untitled document (2)

The main focus of my diagram was to show the interconnections and relationships that are formed from human and environment interaction (the relationship between the human social system and the ecosystem). The addition of a biogas generator in an Indian town subsequently changes the entire landscape. The systems diagram created shows how humans and the environment are a coupled system in which the biogas generator provides positive and negative feedbacks. The generator creates methane which leaves a positive impact on both the social and ecosystem. First, it allows for a cleaner and safer cooking environment free off smoke which aids better health and decreases the amount of air pollution. Second, it reduces the need for firewood, which preserves the land and frees up time for children and women that is normally spent collecting the wood. This free time allows children to attend school, eat breakfast, and women to work on other chores which all increases societies well-being. The system also creates slurry that can be used as fertilizer. Women, now with free time are able to compile the slurry and sell it to farmers, benefiting the women through earning money and farmer who uses it on their crops (leading to increased crop production). With more money being earned, an increased crop production and more natural resources preserved, the population carrying capacity can be increased and a higher quality of life can potentially be sustained for a longer period of time.

My diagram is similar to Figure 1.5 in that they both show the chain of effects that result from introducing biogas generators (technology) to an Indian Village. They both illustrate many of the same points: Methane gas leads to less deforestation, increased health an slurry leads to increased crop production, wealth, and environmental resources, etc.  Both also separate the impact on the social system and ecosystem. Where my diagram differs from Figure 1.5 is that Figure 1.5 is portrayed in a way where you can visibly see the feedback loops that are caused by the biogas generator. For example, the human population demanding fuel–>which causes them to look for new technology–> which introduces the biogas generator to villiages–> which positive impacts the human population. Figure 1.5 is portrayed in a “big-picture” type of way, showing the feedbacks and the direction of the flow of impacts, while forcing you to think deeper into exactly why the flow and connection between two things occur. My diagram on the other hand more strongly walks the viewer through the cause and the various effects that follow in a systematic (easy to follow, one effect is the result of another effect outcome occurring). I think this is all due to slight differences in perspective taken by both I and the creator of Figure 1.5. I am also new to systemic diagrams while the other creator may have more experience. Non the less it shows how landscapes are mentally constructed based on our individual preferences (ex. where we think the impact lies).

Biogas Generator_bdb5296

Geog 030 module 2 chart

As I was creating my diagram I was attempting to illustrate the importance of the relationship between one social system, Bangalore, India and its surrounding ecosystem. Together these two systems can have both positive and negative effects upon each other. For example in this ecosystem people have both a positive effect on the ecosystem by creating compost used for fertilizer and they also have a negative effect by creating deforestation. On my diagram the negative impacts are shown through dashed lines while positive impacts are shown through solid lines. These two groups worked as a coupled human-environment system based off of the way that they both affect each other in different ways. Under the social system side you can see that the people of this community imposed negative impacts by the way that they caused deforestation and also caused health problems amongst the people of their community. But with the introduction of the biogas generators they were able to create many positive outcomes for both the community and the ecosystem.

In comparison to Marten’s 1.5 Figure and my systems diagram, there are some similarities and differences. Both Marten’s and mine have some of the same topics such as Children, cooking, deforestation, and biogas generators. However, there are some differences in that my descriptions on my arrows are less detailed than on the 1.5 figure. By comparing both diagrams, individuals are able to interpret the information differently. One individual might think a topic is important to include while another individual may not. It is very useful to compare and contrast these diagrams in order to see other impactful topics I may have not included.

Link to my blog: https://geog030.dutton.psu.edu/2016/01/27/biogas-generator_bdb5296/

Biogas diagram AIH5176

Biogas diagram aih5176

In this diagram I differentiated between what went into creating the product and the environmental, social and economical effects of the product. In the creation of the product I will focus on what materials are used and their effects. In the other aspect, I will talk about the health benefits, social benefits for people, and financial benefits which will in turn help the economy. Firewood was collected from the environment which had an impact on the tree supply. If we’re constantly destroying the landscape we’re altering a system. We altered the landscape into a human ­environment landscape. We were involuntarily testing the resilience and threatening sustainability. Also, the collecting of firewood has a social and economical downfall, children. They were going to school hungry and unprepared due to their lack of time for studying and homework. This affects the economy by having less educated citizens and disrupts the children on a social scale. Biogas is a better alternative due to the environmental, social and economical benefits. The bi-­product is gas which enters into homes through a pipe. This provides much cleaner air which results in less negative health implications. The products used for biogas are environmentally friendly: concrete, brick and cow dung. The brick is locally made, which is giving back to the economy by buying the brick and not altering the landscape by human destruction. Cow dung is a natural product from the environment that’s used, this creates no need to manipulate the landscape, threatening it’s resilience or sustainability.


Marten’s diagrams are more complex. He links the effects of ecosystems, such as how the human social system influences the ecosystem and vice versa. Ours are similar by him and I speaking about how products affect humans and how humans affect products. For instance, he talks about how human population affects the amount of cooking fuel needed which needs to come from the environment, and how the bi-products get recycled, such as burning. To be honest I think there are similarities and differences because he has had much more practice in this area. He went into further detail and made his diagram on a more global scale, like a commodity chain. What can be learned by examining the similarities and differences is that much more goes into this than we think. I did mine on what seems like a very small scale, when in actuality it’s a much bigger scale. There are several levels of factors that need to be examined and appreciated to fully understand.


Module 2: Biogas

My diagram starts out with the process of wood gathering. In order to wood gather, you must have someone to do it. That responsibility in the village falls mostly on the children. Since the children spend most of their time wood gathering, there is not a lot of time for their studies. This will put the children in the same position as their parents since they will not be educated. Another problem is a wood stove burns the wood. A burning wooden stove puts off smoke. If there is a constant amount of smoke in the house, your health will deteriorate. Changing your energy source to biogas can solve this problem. Biogas is a clean alternative to wood burning. This is because you can have a gas powered stove instead of a wood burning one. There will not be smoke to pollute the house unlike the wood stove. Children also do not have to gather wood. Instead they can spend this time improving their studies. The biogas also has a byproduct of compost. The compost can be collected and sold to farmers to earn extra money to buy food or further educate children. This biogas brings stability to a home because they will always have fuel. My diagram is similar to Gerry Marten’s because we both talk about cooking fuel in our diagrams. They are different because he uses irrigation water in his. There are similarities and differences because we each view things differently. What can be learned from the diagrams is that biogas ties it all together

biogas_rgh5072

Module 2 Learning Activity: Biogas System Diagram

biogas_diagram_mad5946

The main idea behind my diagram was to show the different connections that can be made between the social and ecological aspects in India. It mainly focuses on what life was like before and after biogas plants were created. Overall, I wanted to get across that the biogas plants seemed to really help improve India in many different ways. After reading about resilience and watching the video, I think the biogas plants can also help lead to a much stronger resilience in India, meaning they will be able to undergo more disturbances (if need-be) without as many complications. When comparing my diagram to the one in the Marten reading, I noticed that we had the same general outline. We both separated the two biggest topics and did smaller subtopics underneath of them and branched out from there. The biggest difference that I noticed was that while we had a lot of the same information, he portrayed it differently by putting the subtopics as a much broader topic and having the reasons for connecting the two things as what I put as a subtopic in my diagram. In other words, his seemed a little broader on certain parts, while mine seemed to focus in on certain things a little more. I think there are similarities because we are talking about the same general topic, but differences because each individual has a different way of portraying information. When comparing the two diagrams you can really see how much of an impact biogas plants have.

India’s Biogas Generators_sme5313

GEOG030

Within my diagram, there are core ideas that were learned from reading Module 2. From the Population, Affluence, and Technology tab, also known as the IPAT equation, the famous inventor Kurzweil argues about the point “T” in the IPAT equation. As he believes, some technology can increase environmental impacts while other technology can decrease it. You can see this concept within my India diagram. Under the ecosystem side, you can see that firewood is a concept that increases environment impacts by creating a lot of smoke and causing health problems amongst the citizens of India with dirty air, itchy eyes, and chest infections. However, introducing the biogas generator decreases the environmental impact by reducing health problems since it is clean for the air, as well as producing methane gas, which allows the women of India to use safe and cleaner cooking. The biogas generator also produces high quality, organic compost that women in India cease the opportunity to use, bringing in successful business and more income. Before the biogas generator, India’s environment was relatively unstable because it had a lot of disturbances. However, with the introduction of the biogas generator, India can now be considered relatively stable, due to fewer disturbances from deforestation as well as the firewood’s smoke.

Compared to Figure 1.5 in the Marten reading, “What is Human Ecology?,” my diagram has some similarities as well as differences. Some of the similarities are under the ecosystem side, being that both diagrams have concepts of deforestation, animal dung, and biogas generators. The concepts are very important because they are what is hurting/improving India’s economy and ecosystem. Differences between the two diagrams are the arrows and the short phrases that explain the nature of the interactions. These are differences also because I have different ideas on my social system side than figure 1.5. Between the two comparisons, we learn that there can be many different diagrams created by the way an individual interprets the information. Some diagrams can be very detailed and in depth while other diagrams can be basic with less information.

Module 2 Learning Activity – Katherine Rigotti

The main focus of my diagram was to illustrate the importance of the relationship between the social system and the ecosystem, as together they can positively or negatively affect several aspects of life. For example, the ecosystem was negatively affected by the use of firewood as it emits smoke into the air. At the same time, people were contracting chest infections as well as irritation of the eyes due to that same smoke emission. My biogas diagram clearly indicates that an initial ecosystem complication can lead to widespread complications within the social system as well. Such negative affects are shown with dashed red lines in the biogas diagram. Alternatively, once the biogas wells were implemented, the ecosystem benefited as there was in increase in crop yield and irrigation for farming. The biogas wells also made use of animal waste as fuel, leading to a cleaner ecosystem, which in turn lead to safer and more efficient working conditions. The improved working conditions lead to an enhancement in public health status. This type of “win-win” scenario is also depicted in my biogas diagram with solid purple arrows. Overall, the core idea behind my diagram is a representation of feedback mechanisms. There are both positive feedback loops (solid purple) and negative feedback loops (dashed red) interacting with each other at all levels of the ecosystem and social system. With that in mind, a positive action within a social system can therefore lead to a beneficial change within the ecosystem. This is especially important as our ecosystems have been overwhelmed with negative changes due to global warming.

My diagram is similar to Figure 1.5 in the Marten reading as we both made use of solid lines and dashed lines to represent various feedback mechanisms. Both of our diagrams illustrate the concept of cause and effect between social systems and ecosystems. Our diagrams differ based on the broadness of the category. My diagram focuses mainly on the direct effects of firewood on health and lifestyle, whereas the Marten diagram covers a vast range of effectors such as the overall population, especially children, to technological aspects. These differences can be attributed to the level of detail each diagram possesses as well as which end of the spectrum each is focused on. The major emphasis in my biogas diagram is the chain of events leading to the implementation of the biogas well. The diagram from the Marten reading is focused on the effects after the biofuel generator is introduced to the village. Through comparison of both diagrams, it is clear that social systems and ecosystems depend on each other and a change in one leads to a change in the other, whether that change be positive or negative.

Biogas_Diagram_klr5498

Cassie Hess- Biogas System Diagram

Untitled document (2)

This diagram is intended to show both the environmental and social effects of the Biogas Generator in India. The two systems work as a coupled human-environment system in that they both impact each other in some way. My diagram shows the ways that certain human and environmental factors affect and are affected by each other. In many instances there are negative feedback loops like for example, the air pollution from the burning firewood has a negative effect on the health of the people. There are also positive feedback loops in this systems diagram. The compost from the Biogas Generator has a positive impact in that it creates jobs and income for the people in the village. The true driving force of this system is the size of the population in India. The increased population has caused deforestation and air pollution in the rural areas, which is essentially what drove the introduction of the Biogas Generator. In comparison to the Diagram in Marten’s “What is Human Ecology?”, my diagram has many similarities as well as differences. My diagram is slightly more specific than Marten’s in that it goes into specifics about the negative effects of the firewood as well as the positive effects of the compost produced. Similarly, both diagrams show how different materials are needed in order to use the Biogas Generator and therefore help the “population”. The reason there are similarities and differences among our diagrams is because everyone interprets the effects of different environmental and social factors differently. I might have thought something was more important to include in the diagram, while Marten could have assumed this was implied or unnecessary in displaying. By comparing the diagrams we are able to see multiple aspects of both systems that we might not have seen before. Seeing both diagram helps us to understand all elements that go into the systems and how they have different effects on one another.

Biogas Diagram

The main idea of my diagram is that the Biogas generator is a Human-Environment system. Human-environment is when environment affects humanity and humanity affects environment. They impact each other greatly. The Biogas generator is operated by man and uses environmental sources to create methane gas. This results in a positive end result for humans. It also creates a positive affect on the environment then because when fertilizer is created in the system it helps create more crops and continues in a loop. Humans and the environment are helping each other when the biogas generator is used.

My diagram is similar to the Marten diagram because it shows how human activities affect a social aspect and an environmental aspect. My diagram is different from the Marten diagram because it shows a more cause and effect way. Because of deforestation children are expected to work and due to work they are late to school which affects they’re schooling and other social aspects. There are similarities and differences because each diagram is trying to get across the same point. The Marten diagram shows how the human activities work for the ecosystem and how the ecosystem works for the humans and my diagram shows how working together with the biogas generator creates a better environment and humanity.

BiogasDiagram

Calhoun, Ben Module 2 post

The core design behind my diagram was to illustrate the direct cause and effect of having a biogas generator in any small village. The effects (indicated by the arrows) have a primarily positive feedback benefiting both the local village social system as well as the local ecosystem. With proper construction and management of a biogas generator system, the resilience of both the village social system and the ecosystem in regards to the stressors and challenges related to fuel collection, lost educational opportunities, habitat loss, poor air quality and poor pulmonary health are substantially reduced. This system also has the potential to remain relatively stable if the same conditions of construction and management are met.

In comparison to the Gerry Marten diagram, both diagrams exhibit the same type of cyclical directionality. If something is changed in one system, it has the potential and likelihood to affect change in the other system. This can be referenced by observing the connection between deforestation and time spent collecting firewood (loss educational opportunities). The largest difference in the diagrams is both the perspective and scale at which we choose to illustrate the relationships. While Marten uses a more generalized distant approach, I chose to use a more localized, semi- specific approach. The similarities and differences can be largely attributed to scale. With comparison between the two diagrams you can easily see that the amount of change reflected in my diagram is truthfully only a small section of items affected by the addition of a biogas generator.

bcc5217 module 2 diagram

Biogas Diagram and Discussion, Rebecca Hodge

As I was creating this diagram, I really wanted to make sure each of the aspects, environmental degradation, environmental improvement, and social improvement were all highlighted as the main focus. First of all, I chose to color-code these three categories; degradation is red, environmental improvement is yellow and social improvement is green. Also, on the left side, there is a section with an “x” through it; this is what will no longer happen due to the involvement of biogas systems in these communities. I think that the idea of biogas introduced through the video was very interesting and related to our course objectives well. For example, a positive feedback was introduced in the form of cooking without biogas. The families needed wood to make food, however, there was very little wood, and the children had to skip school to find it. Because so much wood was being harvested, the environment was not able to support so many people, but because the children were not receiving enough education, they were not able to move out to the cities to find work. And the trend continued, the social and environmental aspects continuing to become degraded. However, with the addition of biogas, it is hoped that the woods will demonstrate their resiliency and bounce back instead of possibly becoming a new stable state.

In the Marten reading, he strictly divides his diagram between environmental things and social aspects, but in mine, I chose to mix them all together, as it actually is in reality. Although they look different, both of our diagrams include many of the same aspects of both sides

.biogas diagram rih5212

Module 2 – James Sharer

The core idea behind my diagram is that humans’ social systems interact closely with their surrounding ecosystems, and that changes to our social system can cause drastic changes to the entire system. This human-ecosystem interaction can be clearly seen in the immense impact that one innovative piece of technology can have on an entire community. My diagram charts the interaction of a rural Indian village with a biogas generator that has been introduced to improve their quality of life. The diagram displays how people used to collect and burn wood in order to cook their food, which resulted in harmful smoke production as well as contributed to deforestation. The biogas generator removes the need for wood as fuel, which effectively stops the positive feedback loop of cutting and burning wood. The biogas generator also produces slurry that dries into compost, which can be collected and sold by families for profit, which ultimately increases the sustainability of the community.

In a comparison between my diagram and Gerry Marten’s, there are a number of notable similarities and differences. Both diagrams separate the social system and the ecosystem, which helps clarify the interactions of each. One way that the diagrams differ is in their content and attention to details. Marten’s diagram specifically addresses the dynamic between children and fuel gathering on the social system side, as well as the local landscape and the effect of irrigation. My diagram, on the other hand, takes a more simplified and family-oriented approach to the effects of the biogas generator. I believe these similarities and differences exist because of the inherent unstructured nature of system diagrams and the amount of ways that various aspects can be interpreted. Each person has a different set of experiences and mindsets through which they process the outside world, and visual representations of this are bound to be different. I think that it is valuable to compare different system diagrams, as it gives one the opportunity to identify aspects of the system that may have been overlooked. Additionally, hearing different perspectives on the effect of certain aspects of the diagrams may help clarify their true impacts.

biogas_diagram_jds5748

Module 2 – Kevin Hosterman

The core idea behind my diagram is to show how the implementation of biogas generators would lead to effects on both the social system and the ecosystem. My diagram shows how a feedback loop is created with the biogas generator by producing methane gas and ending the whole back at the social system and ecosystem. It also shows the idea of a coupled human-environment system because most of the end products in the loop improve both the social system and ecosystem because they are so closely intertwined. My diagram is fairly similar to the Marten diagram because it has a lot of the same variables. However it is different because of the way it is organized. My diagram is more focused on the feedback loop that is created with biogas generators while the Marten diagram is more focused on how the social system and ecosystem interact with each other. There are similarities and differences because there are so many different ways that the systems affect each other that you can organize it in many different ways. It’s not a bad thing that they are different because you can learn more from multiple diagrams. Something I learned from comparing them is that it would be easier to organize the diagram between the social system and ecosystem rather than trying to do it all in one big one.

Kevin Hosterman Diagram

Bio-gas Diagram: Wesley Phipps


Biogas Diagram wwp5039The core ideas of my Bio-gas diagram are to show how the proper and efficient use of common animal and human waster through bio-gas  tanks can both help the environment and improve the overall quality of life for poverty stricken rural areas of India. Another important idea we discussed in this lessen are feedback systems.  The bio-gas diagram shows how we are directly influenced and affected by our environment as well as we directly affect it.  the bio-gas tanks in India do an excellent job of both having a positive affect on human quality of life as well as improving environmental conditions.  This is important because many times human comfort is held above environmental quality when we look for economical and technological progress.

Marten’s diagram is similar in that it focuses on both the environmental effects and human impacts the bio-gas technology has.  the key difference is that Marten’s diagram does not focus on the bio-gas technology as the key element in this diagram as I have, instead Marten recognizes that it is only a small piece of the puzzle and its creation was driven by social, economical, and environmental pressures that brought about the development of bio-gas technologies.  I believe that  is the key takeaway from comparing these two diagrams and if I were to redo mine I would centralize my diagram around those issues rather than the bio-gas tank.

Mod 2 learning Activity

My system diagram shows how the biogas generators in India affect people and the environment. The biogas plants use dung from humans and animals and turn it into methane gas. This methane gas is used as clean fuel for women to cook with, and this eliminates the use of wood burning stoves that require wood from trees and pollute the air. Without wood burning stoves, the negative health effects from the smoke are eliminated and children no longer have to spend their study time collecting wood. The biogas generator also produces a byproduct called slurry that people turn into fertilizer. They then sell this fertilizer to farmers to make money, and the farmers use this fertilizer on their crops. Using this fertilizer leads to bigger crop yields and better crops for farmers who then sell this food to other people. In the end, there is a positive feedback loop in which the more dung produced leads to more food being produced. There is also a negative feedback loop where the more methane used leads to less wood burning. My system diagram and the one in Marten’s article both illustrate for the biogas generator produces clean fuel for humans and byproducts that can be used for fertilizer. In the article’s diagram, it includes the demands for cooking fuel and how that leads to the creation of biogas generators, which mine does not. Another difference in the diagrams is that mine points out how the biogas generator reduces environmental problems like air pollution and deforestation, which cannot be seen in the article’s diagram. Since both diagrams illustrate the same ecosystem in India there are many similarities, but there are also difference because I chose to focus more on some aspects of it than others. By observing these similarities and differences, I learned it is helpful to separate the human and environmental aspects of the diagram to clearly show their effect on each other.biogas_bpc5222