
The core values of my Biogas diagram are to visually express the powerful effect that Biogas generators have on the social system along with the ecosystem. The creation of Biogas technology has numerous beneficial effects on the environment and humanity, as opposed to cutting down trees to use as fuel for cooking. As shown on my diagram, the red comments indicate the negative effects that cooking using fuel from trees causes. Whereas, the blue comments represent the positive outcomes that Biogas generators cause which help to maintain sustainability. Instead of just burning trees and creating fuels that can only be used once, Biogas generators place waste through a rotting process allowing us to reuse animal dung as compost. This ultimately increases sustainable development.
When looking at Gerry Marten’s diagram 1.5, some similarities I noticed are that we both mention the social system and ecosystem and their effect on one another. For instance, we both listed human population as having a large impact on the environment. We all know that our population is what ultimately effects our demands, level of consumption and technology, therefore it makes sense that human population will have a large effect on our environment. However, one major difference I noticed is that my diagram focuses on the schooling and the child aspect of the social system. Families, who can’t afford the Biogas generator, have their children work by gathering branches and helping cook. Unfortunately, the time children spend finding branches limits the opportunity they have to do school work. I mentioned in my diagram how the Biogas generator doesn’t run on fuel from trees and therefore children don’t need to be working as much and can focus on school. Although mine and Marten’s diagram focus on different aspects of Biogas generators, together they show different ways to interprete the effects of a Biogas generator and how the social system and ecosystem interact in so many different ways.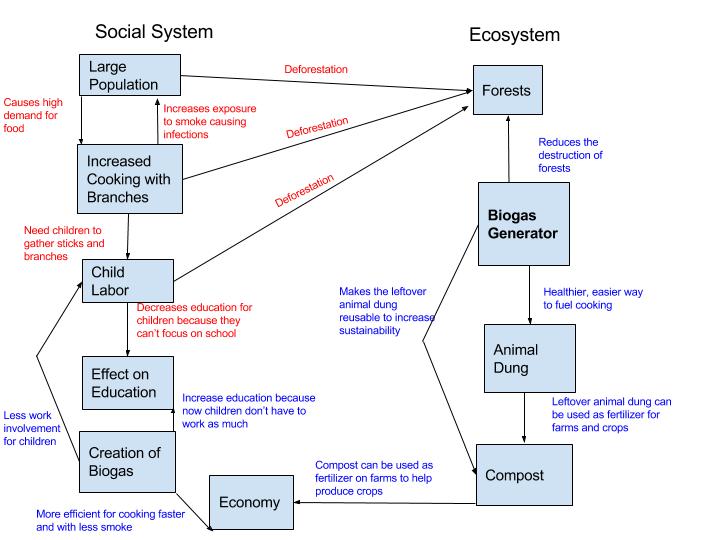
Hi, I like the way how you illustrate the beneficial and negative impacts. In which mine doesn’t show such difference on the graph. Both of us include the deforestation. However, I never thought about child labor but only mentioned that they have less time for school. I have learned a lot from your graph. But I think you should include the negative health impacts in your graph.
Here is my post and may be you want to check out.
http://geog030.dutton.psu.edu/2016/01/24/learningactivity2_wzz5097/