
This is a great example of a human-environmental system where the population effects the environment (at the level of deforestation and smoke emissions) and the environment also effects how the people live in India. Through the use of biogas there are some instances of positive feedback loops, especially where the production of biogas is shown to increase crop yields. By increasing crop yields, there is thus more food for the human population as well as for the animals, which in turn causes more dung to be produced and allows the cycle to continue with the use of even more biofuel. The trees are somewhat resilient, although overharvesting will lead to a point of no return. This shows how the use of biogas instead of burning trees for fuel, keeps the trees at a stable number. This method also shows how improved technology can lead to a better human-environment relationship overall. Upon reviewing Marten’s systems diagram, and then comparing it with my own, I note that they both include an environmental sphere as well as a human impact sphere (How it relates to human society and the economy). There are also positive feedback loops shown in both of the diagrams. They differ however in their detailed organization in that my diagram shows the flow of impacts within each individual sphere while Marten’s shows how each sphere impacts the other. Similarities and differences arise mainly due to what is being studied, I would say. Marten’s systems diagram is looking at a much bigger picture, whereas mine is looking at a particular issue. Seeing these differences can aid us in understanding the details of an issue as well as how they might impact issues on a larger scale.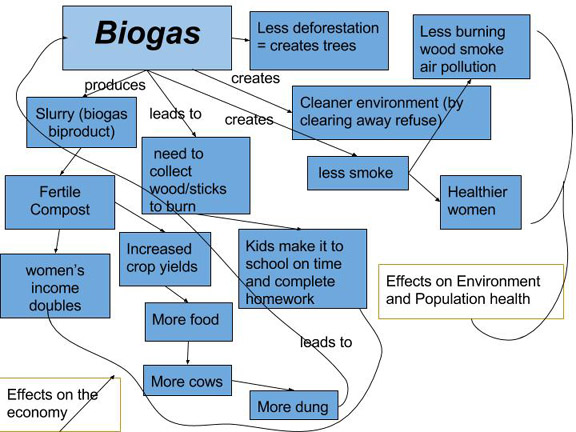
2 thoughts on “Biogas in India – Sara Getson”
Leave a Reply
You must be logged in to post a comment.
Hi Sarah. I like that in your diagram, you were able to address the social systems aspect and the ecosystems aspect of the interaction without splitting it in two halves like how I did with mine. Having one cyclic diagram improves the flow of the diagram and helps with the readability. Your diagram could be slightly improved with a reference to the issues that were once a problem, so that readers can see how they are fixed by the biogas generator. Your writeup of your diagram was concise, and sufficiently provided the information needed to interpret the diagram. If you would like to reference my diagram, it can be found here: http://geog030.dutton.psu.edu/2016/01/27/module-2-james-sharer/
Sara, I really like how your diagram has the biogas in the center of the systems illustrating that they are the solution to the problem. All of your effects of the biogas are clear and concise because I can see what each concept leads to and everything comes full circle. I think that it might’ve been helpful to show some problems with the environment and the humans before the biogas so you could understand how greatly they helped both systems in this example. Overall, I really liked your diagram and your explanation went into great depth about this lesson.
Here is a link to my post as well: http://geog030.dutton.psu.edu/2016/01/27/module-2-molly-mclaughlin/