
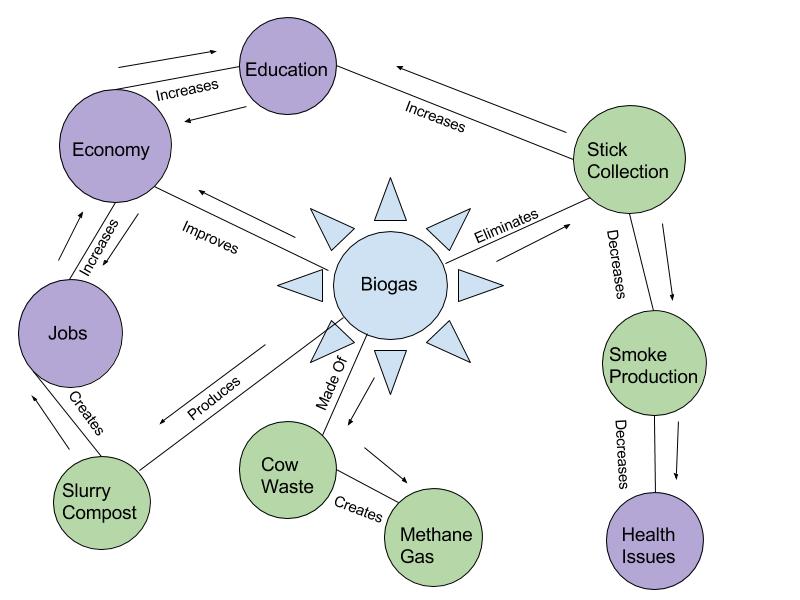
My diagram begins with the main topic of this video, biogas. As the video explains, this innovation creates a system which benefits the environment and the social well-being of the rural community. The purple ideas of this diagram represent the social system, whereas the green ideas represent the environmental system. Biogas eliminates the necessity of collecting sticks for fire, which therefore lowers smoke production. The decrease in stick collecting saves the environment from deforestation, where the decrease in smoke saves the community from health defects. Lack of stick collection also allows the children more time for schooling. Biogas is produced from cow dung, which creates the methane gas. The methane gas is then transported into the household for cooking purposes. The creation of slurry compost creates jobs for the local women, which contributes to the economy. With a better economy, there is more money to pay for education for children. The system diagram shows that everything, more or less, comes full circle. Elimination of stick collection leads to more education, which leads to a better economy and more jobs, which leads to the composting, which leads to the biogas, and so on. The video proved that this is a stable system with little to no complications. I think this rural community proved that sustainability is possible when resources are low, and they can come from something as natural as cow waste.
I did not base my diagram off of Marten’s Human Ecology diagram, so the similarities and differences are present. Where Marten started with the Social and Environmental systems, I started with the main factor that leads to the benefit of both systems. We both connected certain environment and social links together, just in different formats. Also, rather than using “increase, decrease, create, improve,” Marten uses examples like “food, cooking fuel, and cut wood.”
Also here is a link to my post
http://geog030.dutton.psu.edu/2016/01/27/gunderson-mod-2/
Katie, I really like your diagram. You’ve made it very easy to understand the flow and see what you’re trying to communicate (the color coding is legit). I enjoyed reading your post, and I really liked how you tied in sustainability. Good luck with the rest of the course!
Hi Katie! I really like your diagram. You were able to connect almost every single aspect to one another and it is easy to understand. I like the fact that you used the economy as a factor and how it is influenced in the system. I also used the Biogas generator as my main focus in my diagram since it was the main subject of the video.
Here is a link to my post: http://geog030.dutton.psu.edu/2016/01/27/biogas-system-diagram-adriana-buonocore/
-Adriana Buonocore