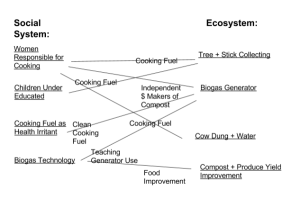
When drawing my diagram, my core idea was to focus on the ideas of resilience and sustainability. Specifically, the notes of the biogas generator helping the women become independent money makers and the compost producing improved yields both with help increase the social system and ecosystem resilience and sustainability in any area where the biogas generator is used as it should.
I think my diagram is remarkably similar to the figure in the Marten reading. The gathering of cooking fuel drove the key elements on both the social system and ecosystem side of my diagram. I think my diagram breaks down the human population/impact piece more specifically. If I had space in the diagram or if more subtext was asked for, I would have broken down the responsibilities and outcomes to the women in that community into more detail, as well as emphasized the negative outcome to the children (mainly their education). I think there are similarities because the Marten diagram is a well-constructed one about the same topic and I think mine is different because of the perspective and history I bring to the assessment, notably the additional attention I gave to women and children. In comparing the two, I think that I could have spent more time looking at the common factors between the major components. I am clearly more comfortable keeping contributing elements in their unique categories, where the Marten diagram has more connection points.


Hi Erica,
I completely agree about women being a key factor in this diagram. When the compost enabled a job and source of income for them, it not only created a negative feedback for the population, but a positive feedback for education. With the money from profits, it fueled their education. That in turn will help further technology. It would be interesting to hear further how much of an impact it had on the men in the town. The sustainability is important to consider, and I learned how these diagrams can be a valuable tool.
I, like you, have to stop and think about the connections a bit more. I learned I can miss them pretty easily (although I don’t think it is hard to miss something). Here is a link to my diagram/post: http://geog030.dutton.psu.edu/2016/01/23/biogas-diagram-tanya-smith/
Tanya