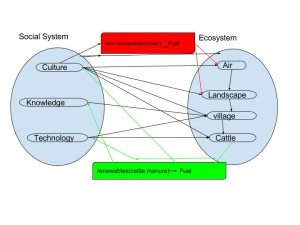
The main idea behind my diagram is to show the social and ecosystem relationship between the renewable and nonrenewable resources used for biogas. It also shows the relationship the overall concept of the biogas system from the start of knowledge, culture and technology to the landscape, cattle, air and villages. The red lines display the negatives of using nonrenewable resources, trees. The reason that I put trees in the nonrenewable category is the villages use the trees for fuel. The need the wood from the trees to create a fire to cook etc. With the constant need for wood for fuel they are using the resources quicker than the trees can reproduce. This in turn causes a decrease in the population of trees in the ecosystem in the villages.
The diagram from “What is Human Ecology” and my diagram are similar in a way we showed the process of biogas from manure. The Big difference in mine and Marten’s was that his was a lot more advanced. I did not look into the science of the biogas, instead I chose to look at it from an environmental viewpoint. Marten’s diagram is a lot more technical and breaks it down even further than I did. He included the human population where I coupled it all together under culture. Something can be learned from mine that was not shown in his, the negatives of cutting the trees for fuel and the increase in knowledge and technology to create a better idea, turning manure into fuel.

