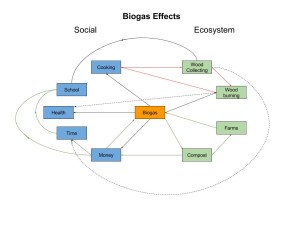
This diagram demonstrates the social and ecosystem effects that the introduction of biogas induces. The arrows indicate how one component interacts with another. For example, biogas produces compost, which can be sold for money, and used for farming. The diagram shows three positive feedback loops (green) and one negative feedback loop (red). One example of a positive feedback loop is that biogas produces compost, which is used on farms, which in turn make more biogas. The negative feedback loop is produced when biogas is introduced. normaly cooking requires wood burning, which requires wood collecting. When biogas is introduced this need for wood burning decreases, which means the need for wood collecting also decreases. Both the wood collecting and burning had adverse affects on schoolwork, time, and health, so the negative feedback loop has a positive effect on the system. When comparing this diagram to figure 1.5 in the Marten reading, it can be noted that there are many differences. This diagram breaks down the social aspects into health, money, time, cooking, and school work, while figure 1.5 uses a broader range of the human population. Figure 1.5 does not clearly show the social benefits such as improvement to health like this figure does, which is something that can be learned by examining both figures. They do use very similar concepts however, which is what makes them similar.
Tag Archives: sustainable energy
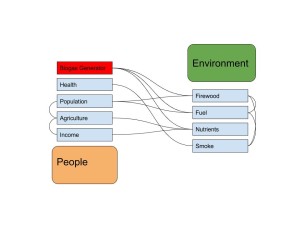
I used a couple key concepts from module 2 to help me construct this system diagram. Biogas production in rural India affects the people and environment there in many ways. Utilizing the biogas generator utilizes technology to increase the carrying capacity of the system. When using exclusively firewood for fuel, the people had one resource that could be depleted. Technology allows people to use a waste product to increase the available fuel for cooking and heat. I highlighted the biogas generator in a different color because it is the main driver of change in this example. Once biogas generation is possible, Firewood collection is reduced and people spend less time gathering it. Fuel is produced from the generator which reduces the polluting smoke of firewood, and gives people an efficient form of energy. The generator also produces usable nutrients which reduces pollution to the environment and produces income. The nutrients also boost agricultural production which again gives people income and more food. The addition of the generator to the system increases the stability of the system because there are fewer inflows and out flows. My diagram is similar to Marten’s in that there are two main interaction categories of humans and the environment. My diagram is different because it is more focused on the effect of the generator than the overall cycle. There are similarities because the purpose of the biogas generator is to effect the dynamics of the social-environmental system. It shows that these are complex systems and it is hard for a systems diagram to simplify it to just a couple interactions.
Impact of Biogas Generators on Livelihoods of Individuals in India
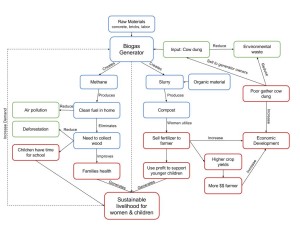
The system diagram below represents the chain of effects that biogas generators have on the rural ecosystems in Bangladesh, India. The current problem people of this region face without a clean fuel alternative to wood burning is degradation of the land and health issues in young children and women. Biogas generators allow more time for children to go to school, improve living conditions and health, and create a compost product, which women utilize to generate income. The core ideas behind my diagram are the social, environmental, and economic factors that cooperate to transform biogas generator technology into sustainable livelihoods for women and children. I view an ecosystem as an interaction between the physical environment and human social system. Coupled human-environment systems show the impact of the relationships between the human social system and ecosystem.
Notice that the diagram is divided by color: blue (direct factors of biogas production) green (environmental effects), and red (social and economic benefits).Together the generator and women entrepreneurs reduce environmental waste, improve the lives of their children, and create a product that aids the farmers of rural areas.
Figure 1. Local impact of biogas generator in rural Bangladeshi, India.
 Compared to Marten’s diagram, this diagram has few similarities, but both pay attention to the environmental impact and demand for biogas generators. Marten’s diagram focuses on the larger social system while this diagram is specific to the livelihood of the individuals affected. There are similarities and difference between our diagram because we are concentrating on different scales. My diagram is a local scale while Marten’s focuses on a regional scale in India. It is important to compare diagrams to understand all the factors involved in systems. Each of us think critically about different elements of the system. By examining each diagram, we can learn a different point of view about the same system.


