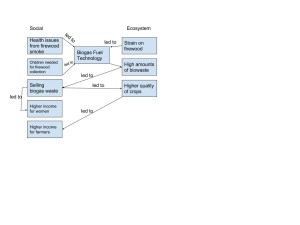
I created my diagram with the core ideas that there needs to be a demand for change for change to actually happen. In this case there was a demand for new technology to change the use of firewood for cooking stoves in India. This demand was caused by the health issues from the smoke, and also the time required to gather the required amounts of firewood. These concerns can be shown in the social column of the diagram. The ecosystem demanded that firewood be replaced, because this area was running out of available firewood. These problems lead to the demand for the biogas fuel technology or the “Biogas Plant”. This technology solved the problem of the smoke and firewood issues in India, but there was still demand for higher income for women, and also a demand for higher crop quality. This sparked the addition to the biogas plant of being able to collect and sell the biogas sludge as a fertilizer. This then solved the problem of higher income for women, and also increased the crop quality in India. This core idea can be compared to the idea of population vs. carrying capacity. The demand for new technology to support larger and larger populations is constantly increasing. As this demand continues to grow so will the technology and therefore the carrying capacity will continue to grow with the population. I think this diagram is fairly similar to Marten’s but with the exception that his is much more broader. The diagram in this post is designed specifically for the biogas plant where Marten is a much larger scale. Both of the scales show how different aspects of social and ecosystems interact, and how different demands can lead to different technologies and knowledge.
2 thoughts on “William Graf – Module 2”
Leave a Reply
You must be logged in to post a comment.


Hi William, my name is Caren Levin feel free to check out my blog!
http://geog030.dutton.psu.edu/2016/01/24/caren-levin-module-2/
I like how you organized your diagram by placing Biogas Fuel technology in the center, between social system and ecosystem. It emphasizes the effects that this alternative system has on the social and ecosystem in India. I think it’s really interesting how you pointed out the idea of demands and how demands are what impact what we do next. It makes sense though, because our world is constantly changing and trying to improve, so it is only a matter of time before we come up with an even more advanced system to increase sustainability. I also like how you mention specifically women’s income and the quality of crops because this is a major result of the Biogas generator. I didn’t mention these concepts in mine diagram, but I think it’s a great addition to show how the demands are effecting India’s society.
Hi William! I like how your diagram shows the demands that lead to the creation of biogas. It is important to show what caused something to be made and you clearly showed that in your diagram. I also like that you focused on the aspects of what happened after biogas was created (like the compost which lead to an increase in salary). In my diagram, I also talked about the demands that lead to biogas and the outcomes; however, I like how you elaborated on the outcomes more, unlike me. If you’d like to compare diagrams, here is mine: http://geog030.dutton.psu.edu/2016/01/23/biogas-diagram-jessica-moritz/.
-Jess