
My diagram on the movement of ways in which the introduction of the Biogas chambers have on benefiting a community. The Biogas tanks offer much more than just a source of fuel for the homes of many, but they also many jobs and food for the families affected. For example, the Biogas chambers create a fuel source, but they all decrease the harmful effects of smoke from burning dry trees. This means that people are healthier and can provide for their families longer. The Biogas chambers help to make communities more resilient. The people of each village now do not rely on the availability of trees and twigs, which will allow them to continue to cook even if something were to happen to their trees or shrubs. In addition, the villages are more stable, as a small disturbance, such as a drought, will not affect their fuel source anymore.
My diagram compared to the Marten reading is different and alike in a few ways. In my diagram, I dealt largely with the products that the Biogas chambers provided, such as increased jobs and healthier conditions. The Marten diagram, they largely dealt with the “before” aspect of the Biogas chambers. I, on the other hand, liked to look at the positives of the Biogas generators after their installation. There are similarities and differences because of the scope in which an ecosystem can be viewed. The Marten diagram viewed the ecosystem before the Biogas tanks, while I viewed the ecosystem afterwards.
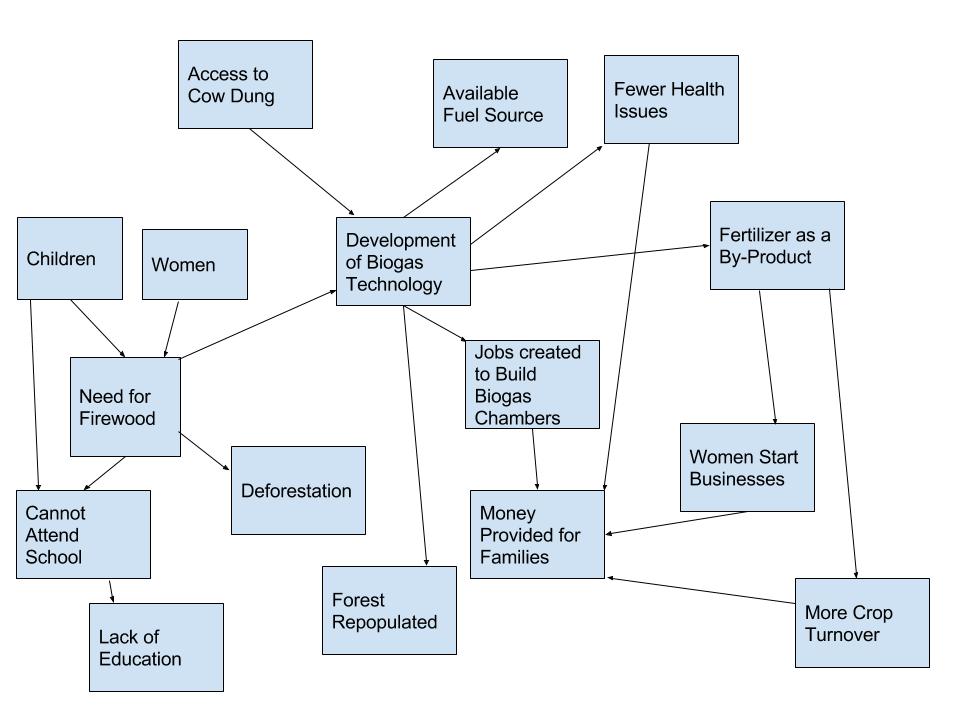
Hie Dhruv, this is Akiksha, currently a freshman at Penn State. I like how your diagram highlights the many advantages of biogas technology in India. Also, I agree how small disturbance won’t interfere in the fuel source but it might otherwise. I like how you’ve also shown that the firewood way was causing deforestation and how that method prevented children from going to school along with highlighting the many advantages of the system. Also, another difference in yours and Fig 1.5 could be how you’ve highlighted the advantages and disadvantages and that Fig 1.5 tells us how both eco and social systems are affected along with how they co-exist.
Here’s a link to my post : http://geog030.dutton.psu.edu/2016/01/26/biogas-system-diagram/ . I hope you’ll go through it too.