
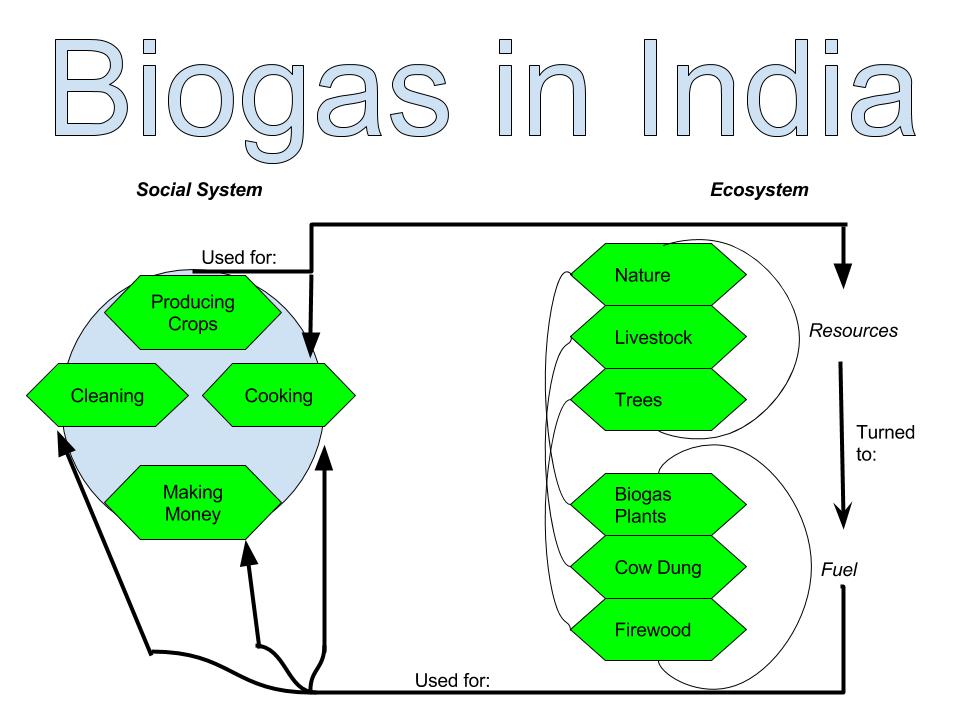
Biogas in India is one of the simplest real-life examples of how a social system can impact an ecosystem and vice versa. The ecosystem starts as just natural resources, such as livestock and trees, as shown on the diagram. These natural resources are eventually turned into fuel, because of the societies necessities of cleanliness, food, and some sort of income. As the demand for these grow with a growing population, the people begin to produce their own crops, adding to the natural resources of the ecosystem. This cycle will continue to grow until eventually; the soil dries up and can’t be used anymore. This is one of the easiest ways to understand the “IPAT” equation, because as the population rises, the impact on the ecosystem (the soil being used up) becomes greater until it reaches its carrying capacity, in which the population will have to either make a significant change, or begin to drop.
This chart differs from figure 1.5 mostly because of where they both go into detail. The chart that I have made goes a lot more into what they are using the resources on specifically, (cooking, cleaning, money, etc.) instead of why they need these things. Figure 1.5 has more detail into why these things are in such demand (the population rising, resulting in the need for more food.) I feel in terms of the big picture, these diagrams are both very similar, with different details in different areas.
Hey Seth! Your chart was very well designed in the way that you put each small category into a larger category of classification. That way we can see all of the resources used for fuel or what the biogas will be used for. We can learn a lot from your diagram compared to mine because you explained an overall cycle of the ecosystem while incorporating it into how it works with the generator with your example of how trees are grown and then turned into fuel. I tried to focus on how the resources are directly used for the generator and then what the generator produces.
Here’s a link to mine: http://geog030.dutton.psu.edu/2016/01/27/module-2-learning-activity-victoria-s/
Hi Seth
Hi Seth,
I like that you focused on the actual form of resources used and then the parts that go into the fuel production. Your diagram is very vibrant and easily understood. I enjoyed your use of circles to show how the fuel and resources are used. The social system is simple compared to Marten’s, and you provided an explanation. I did not consider that compost would lead to producing their own crops; this is a great view. I considered it regarding the benefit of the farmer to produce more yields. My diagram is similar to yours in that we both explain in detail the input and outputs of biogas production. You can check out my diagram here: http://geog030.dutton.psu.edu/2016/01/26/laurene2/