
In my diagram I created for Biogas Generators I wanted to use it or portray it in a systems perspective. Meaning the social system and the ecosystem are two different systems but they are working together to hopefully get a positive result. The arrows pointing from one system to another are to show how they each effect each other while all being in the same system. For example on one the first arrows goes from soil to income. Now when biogas generators have created this methane gas for cooking there is an compost left over for the cow dung or plant residue use. This compost can be converted into soil. Woman sell this soil to farmers for money to create an income. Another example is the arrow from population to forests. Now families without biogas generators use wood or brush to fuel or cook there food. Usually its the children’s job to get this for the family. Families believe the more children the more fuel for cooking. But since the population has grew over time so much deforestation has occurred which becomes a huge problem. So hence the biogas generator. This means no more wood or brush to burn and less children which is less population. Which means the forests will grow back and not decrease. It is just important to realize that even the smallest part of a system can have a huge impact on anything else in the system.
To the diagram we read about in Gerry Martens reading “What Is Human Ecology?” i think our diagrams are very similar. You have two different important systems working together to create an over all function. Each system is showing positive feedback for each individual arrow thus bettering the environment. Our diagrams are a bit different because I was focusing more on how each system is helping one another with biogas generators. Marten’s diagram is showing how population and deforestation and more of the negative aspects are affecting each system. There are similarities and differences because we each view each system differently. Even know most of the information in the diagrams are the same they are slightly different because everyone portrays each system in there own mind. This is a good way to introduce ecology because you are seeing the relationship between people and the environment.
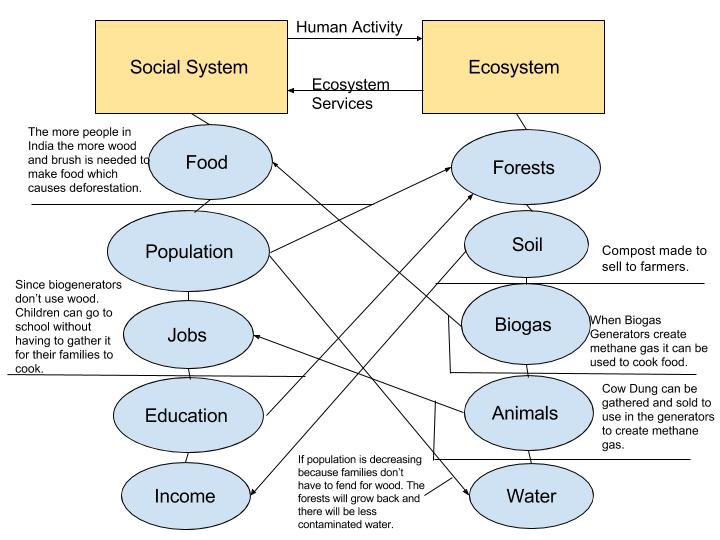
Biogas Diagram
Hi, I’m Ashlee! I like how in your diagram you sort of made everything connected. I find your diagram similar to the Marten diagram, but different in some ways. In my diagram I tried to make environment and social their own separate things and then interconnected them with cause and effect basically. I enjoyed your post and diagram. Here is a link to my post if you would like to check it out. Thanks, http://geog030.dutton.psu.edu/2016/01/27/biogas-diagram/
Lucas, I really liked your diagram and post. Our diagrams are set up similarly in the way we have social system and ecosystem on two separate sides and a lot of the same components on each side. I also liked how you had more in-depth explanations describing the parts of your diagram. Overall, I really liked your post and I thought your diagram was in depth and easy to follow!
Here is a link to my post!
http://geog030.dutton.psu.edu/2016/01/27/module-2-biogas-diagram-2/