
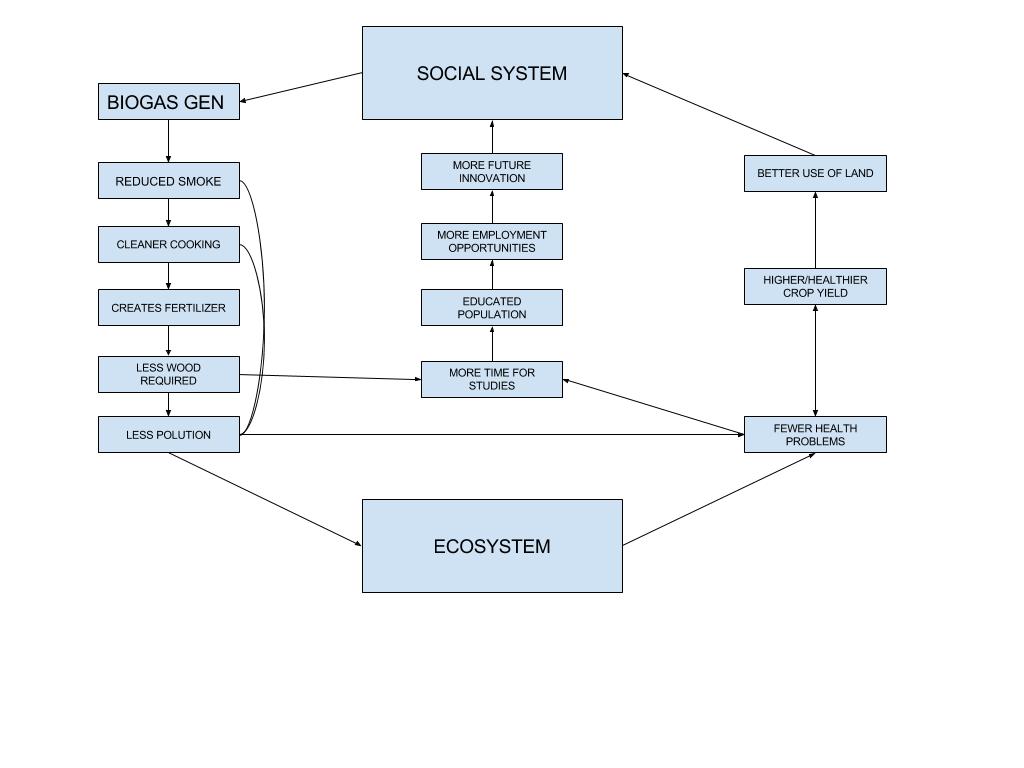
The diagram below shows that the social system provided the means for someone to innovate and create the biogas generator. Biogas generators provide reduced smoke which facilitates cleaner cooking and less pollution as well as creating fertilizer through using dung. Because there is less wood required, children can spend more time in school and on their studies which will result in higher education, more/different employment opportunities, and (hopefully) future innovations. All of this came about because of fewer health problems which also facilitated higher crop yields and better usage of land. The diagram shows a system that isn’t very resilient, in my opinion. For example; if there was a disease that affected cow/farm animal population drastically, then there would be little or no dung to use for biogas, forcing people to revert back to using wood for their primary source of fuel which would either cause a breakdown of the rest of the system or severely hamper its efficiency. In regards to population this represents both, a positive as well as a negative feedback loop. It reduces the need for the large families to gather wood and work, but at the same time it will provide economic opportunities for people, that will be able to support larger families. Compared to Gerry Marten’s diagram: There are similarities in that they both show causes, effects, and solutions. My diagram shows an overall flow between the ecosystem and social system not just cause and effect. They’re similar because it’s based on the same situation.
Hi Taylor! Your blog post caught my eye because I noticed you made your diagram different from everyone else’s having the biogas generator category on the side, instead of the events surrounding it. In my diagram I had separate categories for the social system and ecosystem. Even though you didn’t put any words along your arrows I was still able to perfectly understand your diagram. You thought really in depth about these issues bringing up the resilience and negative/ positive feedback loops. You also brought up a great point about the cow dung. We need to start thinking of a backup way to fuel the generator. Here’s a link to my post http://geog030.dutton.psu.edu/2016/01/27/module-2-learning-activity-victoria-s/
Salutations! I really like how clear and clean your diagram looks. It makes it really easy to see how you organized your information. I also like how you incorporated pretty much everything into never ending loop of causes and effects. Your explanation too was also very clear. I would like to comment though on the idea that the system may not be very resilient. I definitely see your point, however maybe more than just cow manure can be used in this process. It may currently be the most abundant, but if something was to happen which significantly decreased the amount of cow dung, perhaps something else could be used in a similar way. That’s where the innovation would come in, I would say. Overall I really liked your ideas presented in your system diagram! Here is a link to mine as well http://geog030.dutton.psu.edu/2016/01/27/biogas-in-india-2/