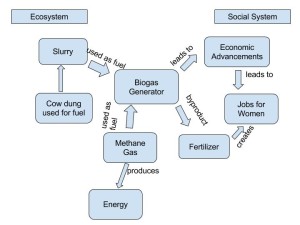
My diagram showing the relationship between the ecosystem/social system and the biogas generator is an example of the coupled human-environment systems idea. As discussed in this module not only do humans have an impact on the environment, but the environment impacts human systems as well. My diagram represents both the outcomes of the biogas generator (i.e. economic advancements) and the resources needed to fuel it (i.e. slurry and methane gas).
When comparing my diagram to Gerry Marten’s there are quite a few differences. Marten included more aspects of the social system in relation to the generator, such as the human population and the demand for cooking fuel. On the other hand, I started with the economic advancements of using biogas and did not incorporate the demand for the fuel. In regards to similarities, both graphs represent the resources needed to fuel the generator. These similarities and differences exist because of the concept of perception. Everyone views a system with a different perspective and some may see more relationships than others. Comparing these two diagrams allows one to see these different perspectives and provides information that cannot be obtained just by reading about a system. It is sometimes much easier to have a diagram in front of you to fully understand a concept, especially that of a biogas generator.


Hi, Emily,
My name is Harrison. I appreciate your reply to my post, by the way! Your description of what your diagram explains is very thorough. I like the idea you had of splitting up the social system and ecosystem, but keeping it within the same diagram. It definitely draws out a perspective of how the two are interconnected with their advancements in biogas. Nice job!
– Harrison
Hi Emily! I am Lisa! I enjoyed reading and looking at your diagram! We talked about some of the same information. I talked about how fertilizer, women, and methane gas connected as well, but I did say that methane gas was used to help women prepare dinner! I did enjoy your take on the different uses of the items/things. Overall, I think that you did an awesome job. I would love for you to check out my blog! Here’s a link: http://geog030.dutton.psu.edu/2016/01/25/module-2-diagram/
Emily, as a visual learner, I agree that the diagrams help a lot more than just reading a piece. As you look through the module 2 responses, you see many different types of diagrams. Comparing them all is hard because of individual perceptions on the ideas presented. Your diagram focused more on the inputs and outputs of the generator. My chart showed a lot more of the social problems that existed before the generator became a solution. Marten’s diagram was a very broad idea of systems, but I think the diagrams posted in this blog differ because of the specificity and the perceptions of our classmates. Here’s a link to my post http://geog030.dutton.psu.edu/2016/01/25/biogas-diagram-nicolina-dimascia/
Hi Emily, I am Tenaya Mulvey. I currently live in Fort Worth Texas where it’s nice and warm in comparison to those in the East. Your biogas diagram caught my attention because you did it differently than I had thought to do it. I liked how you made the central driving force the biogas generator which it made it a lot easier to understand. I feel like yours was not all over the place and flowed very well. My diagram was based on the assumption that everyone knew it was for biogas and the relationship between the social system and ecosystems whether it was good or bad.
Here is a link to my blog entry- http://sites.psu.edu/geog30/2016/01/23/biogas_tenaya-mulvey/