
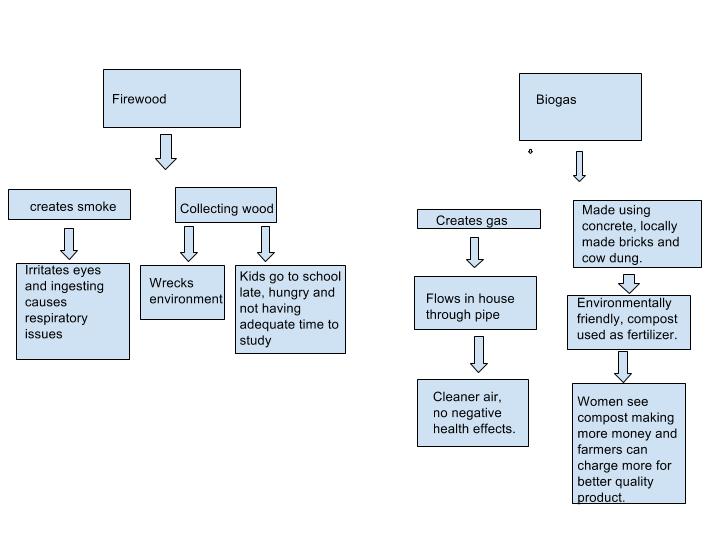
In this diagram I differentiated between what went into creating the product and the environmental, social and economical effects of the product. In the creation of the product I will focus on what materials are used and their effects. In the other aspect, I will talk about the health benefits, social benefits for people, and financial benefits which will in turn help the economy. Firewood was collected from the environment which had an impact on the tree supply. If we’re constantly destroying the landscape we’re altering a system. We altered the landscape into a human environment landscape. We were involuntarily testing the resilience and threatening sustainability. Also, the collecting of firewood has a social and economical downfall, children. They were going to school hungry and unprepared due to their lack of time for studying and homework. This affects the economy by having less educated citizens and disrupts the children on a social scale. Biogas is a better alternative due to the environmental, social and economical benefits. The bi-product is gas which enters into homes through a pipe. This provides much cleaner air which results in less negative health implications. The products used for biogas are environmentally friendly: concrete, brick and cow dung. The brick is locally made, which is giving back to the economy by buying the brick and not altering the landscape by human destruction. Cow dung is a natural product from the environment that’s used, this creates no need to manipulate the landscape, threatening it’s resilience or sustainability.
Marten’s diagrams are more complex. He links the effects of ecosystems, such as how the human social system influences the ecosystem and vice versa. Ours are similar by him and I speaking about how products affect humans and how humans affect products. For instance, he talks about how human population affects the amount of cooking fuel needed which needs to come from the environment, and how the bi-products get recycled, such as burning. To be honest I think there are similarities and differences because he has had much more practice in this area. He went into further detail and made his diagram on a more global scale, like a commodity chain. What can be learned by examining the similarities and differences is that much more goes into this than we think. I did mine on what seems like a very small scale, when in actuality it’s a much bigger scale. There are several levels of factors that need to be examined and appreciated to fully understand.
Hi Alexandra. My name is Ben Bishop and i am a freshman at University park. After looking at your systems diagram, I noticed some differences between your diagram and mine. For example the way we approached the layout is slightly different. I categorized my topics by social systems and ecosystems. However you categorized yours by the fuel types. Although there are differences we were similar in the impacts of both fuel types. I think you did a really nice job and would appreciate it if you took a look at my blog!
Heres a link to mine:
http://sites.psu.edu/geog30/2016/01/27/biogas-generator_bdb5296/
Hi Alexandra. My name is Adam Abbott and I am a senior majoring in IST. I like how your diagram is a little different than the other ones I have seen. You take a more direct approach to the issues specifically linked the firewood and biogas. In my diagram I demonstrated how the social aspects linked to the ecosystem aspects and in turn created a diagram more similar to Marten’s. I think you present more of a flow that is easier to read and follow than mine does. I enjoyed reading your description, and I think you did a great job of describing why your diagram is the way it is.
Feel free to take a look at my post and compare our diagrams: http://sites.psu.edu/geog30/2016/01/27/module-2-biogas-diagram-3/