
My system diagram shows how the biogas generators in India affect people and the environment. The biogas plants use dung from humans and animals and turn it into methane gas. This methane gas is used as clean fuel for women to cook with, and this eliminates the use of wood burning stoves that require wood from trees and pollute the air. Without wood burning stoves, the negative health effects from the smoke are eliminated and children no longer have to spend their study time collecting wood. The biogas generator also produces a byproduct called slurry that people turn into fertilizer. They then sell this fertilizer to farmers to make money, and the farmers use this fertilizer on their crops. Using this fertilizer leads to bigger crop yields and better crops for farmers who then sell this food to other people. In the end, there is a positive feedback loop in which the more dung produced leads to more food being produced. There is also a negative feedback loop where the more methane used leads to less wood burning. My system diagram and the one in Marten’s article both illustrate for the biogas generator produces clean fuel for humans and byproducts that can be used for fertilizer. In the article’s diagram, it includes the demands for cooking fuel and how that leads to the creation of biogas generators, which mine does not. Another difference in the diagrams is that mine points out how the biogas generator reduces environmental problems like air pollution and deforestation, which cannot be seen in the article’s diagram. Since both diagrams illustrate the same ecosystem in India there are many similarities, but there are also difference because I chose to focus more on some aspects of it than others. By observing these similarities and differences, I learned it is helpful to separate the human and environmental aspects of the diagram to clearly show their effect on each other.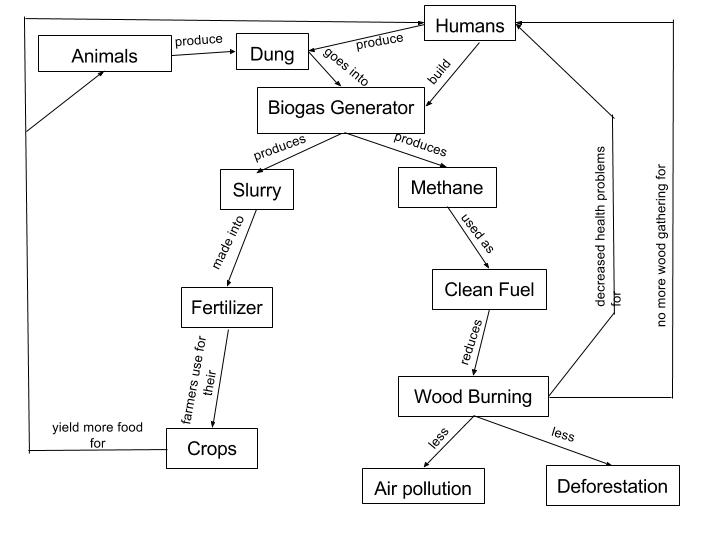
One thought on “Mod 2 learning Activity”
Leave a Reply
You must be logged in to post a comment.
Hi Bryan, my name is Katherine. Your biogas diagram caught my attention as it does not directly indicate the ecosystem versus the social system. In this way, the effects of each aspect of the environment on the social system are more obvious (and vice versa). I can easily begin reading your diagram starting with humans, and then follow it around to air pollution and deforestation or, alternatively, increased crop yield. Another difference between our diagrams is that I focused on the demand for cooking fuel, whereas you did not. It is interesting to see the many views on the interaction between social systems and ecosystems.
Here is a link to my blog:
https://sites.psu.edu/geog30/wp-admin/post.php?post=42617&action=edit