
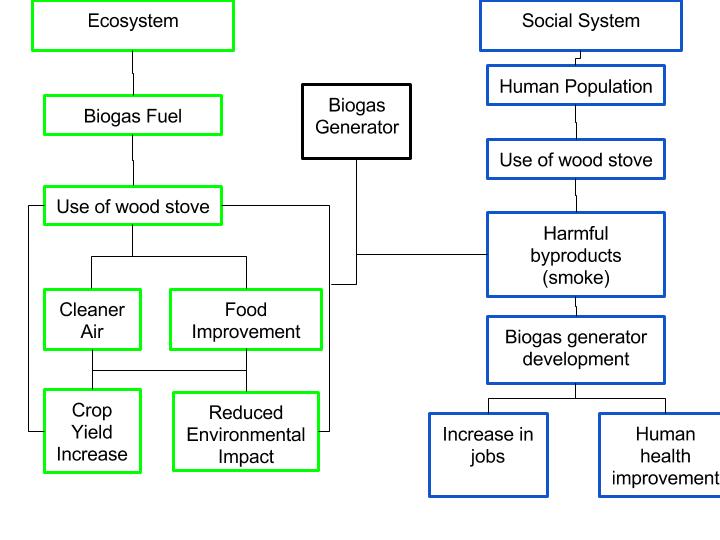
My diagram follows the relationship between the environment and the population of India; focusing on the induction of the biogas generator. It shows that as the population uses wood burning stoves for heat and cooking, harmful byproducts are released. These have an effect on the environment as well as the human population. The diagram goes on to show that the introduction of the biogas generators have had a positive contribution on these same aspects. When compared to Marten’s diagram 1.5, we can see that my model follows a more linear layout while Marten’s shows more specific factors overall. I attempted to give a simplistic, overarching view of these relationships.
Hi Brian, I’m Ian your post caught my eye with the simplistic approach feel free to check mine out here: http://geog030.dutton.psu.edu/2016/01/27/ian-duchene-biogas-in-india/
Your chart is welcoming with the fact you are not attempting to follow intersecting arrows all over the place. I also, feel it is helpful how you have it split between the Ecosystem and the Social System. I had a similar approach when making my diagram but it is a bit different. When comparing ours you will notice that I included the negative affects of a wood burning stove in the home, and then how a biogas plant was advantageous in comparison to a wood burning stove. That was not a requirement of the assignment, but I thought it would help illustrate the overall impact of the biogas plant in India.
Hi Brian, my name is Omar. Here is a link to my blog post: http://geog030.dutton.psu.edu/2016/01/27/module-2-omar-montasser/. I find your system diagram similar to mine in general. For example, we both show how biogas generators improve health and reduce smoke. Moreover, I find your insight into how biogas generators increase jobs interesting. I think the demand for biogas generators has created a demand for people that can build them which creates more jobs.