
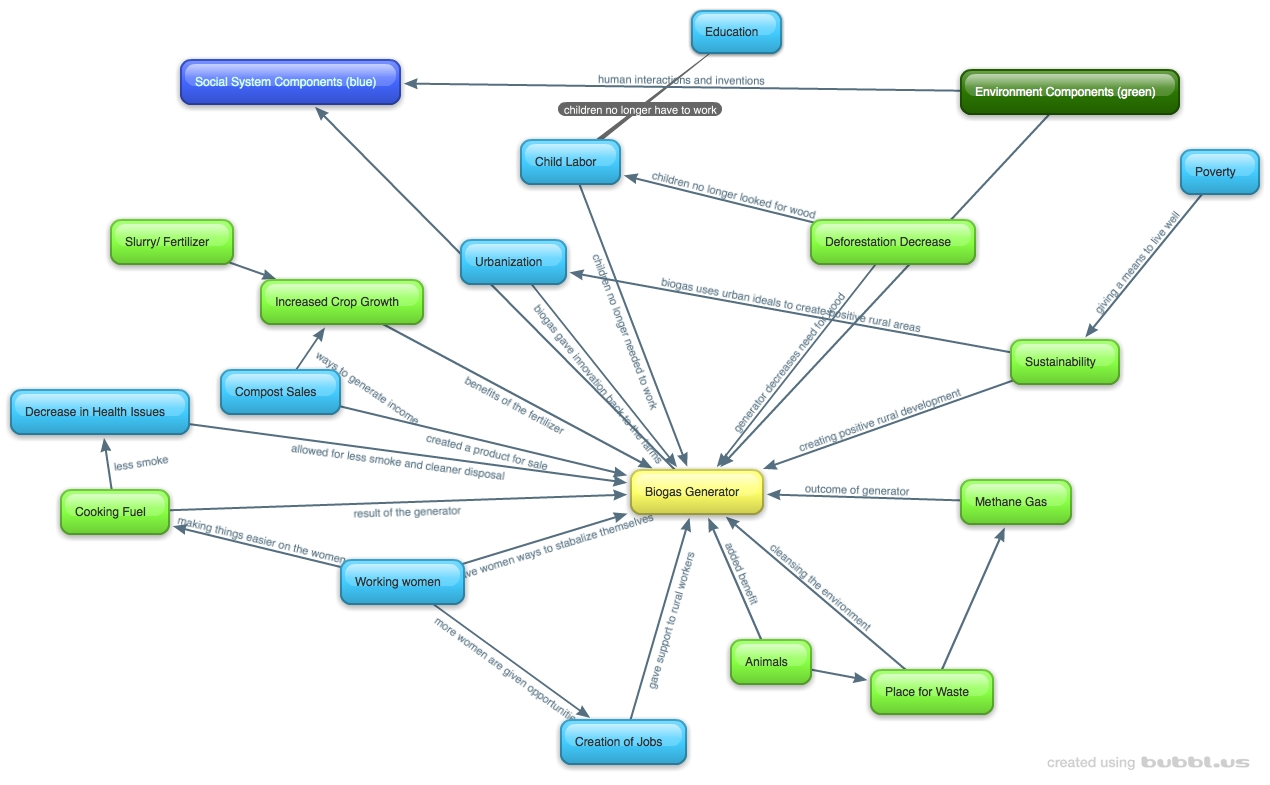
My system diagram depicts the important detail that everything happening is because of these biogas generators and their insertion into the specific environment. I have all of the ideas from the video linking to the biogas generator, in the center. These generators are having such a positive effect on the environment and the social system in India, and I thought it significant to point out this systems perspective and the connections between the components. There are also clear connections between the environment and the social systems. For example, the cooking fuel that is generated from the biogas generator decrease health issues for the people. There is less smoke inhalation and less eye irritants, both, which would cause issues in the future. These biogas generators are so beneficial to the people of India because they were created to aid in the very issues that were present. The creator, being a person from India, understood the perceived issues these rural workingwomen were experiencing. Another positive about the generator, depicted in the diagram, is the constant feedback between all of the components that creates a very stable environment for the people involved and the surrounding biotic factors. However, because this is such new technology, there may be kinks between the components, which could cause times of instability, but in the end, will increase resilience and possibly improve the technology.
My diagram and the diagram in the Marten reading are similar because of the interconnectivity and the basic strong feedback between all of the components. There are biotic and environmental components along with social factors. The Marten system has broader terms in comparison to my system and doesn’t match the centrality of my diagram. Mine has a central point because it was focusing on the biogas generator. The Marten system was the feedback and interconnections between the human ecology, which could explain the broader terms. The differences, again, stem from the different contexts of the systems. Although, it would be possible for the Marten diagram to be explaining the effects of the biogas generator, mine pinpoints the insertion of this technology. Comparing the two diagrams can show that there is more than one way to explain these interconnected components of the environment and the human population. Another outcome is knowing that even the newest technology can fit into the human ecology system that Marten depicted. Overall, there were many similarities and differences between the diagrams: the interconnectivity and the specificity.
Hi Alyssa! I think we took Soc 119 together last semester. Anyway, your graph is so clean and covers absolutely everything. Its amazing how everything in the rural countryside came full circle because of the tech revolution and life for everyone was improved because of BioGas. Check out my blog post here: http://geog030.dutton.psu.edu/2016/01/26/module-2-biogas-in-india-tyler-brackbill/
Hi Alyssa! I first want to say that you diagram was done very nicely! I like how you color sorted each system and the biogas generator itself. That helps understand how each system concept bounces off each other. The biogas generators got rid of negative effects on the environment. I think it was a brilliant idea to come up with to help the environment in India. The wood burning stoves really affected children. Your diagram compared to Figure 1.5 has a central point. All of the concepts lead to the biogas generator. I think you did a great job with this activity! If I didn’t do this activity, I would’ve understood what it was exactly about by looking at your diagram and your explanations.
Here’s the link to my post:
https://wp.me/p3RCAy-b28
-Kelsey Somers
Great Diagram! Our Diagrams were similar, it seems that the survival of this poverty stricken area relies on this new technology of biogas generators. It is very interesting that you placed the bio gas at the center of the diagram. You bring up a good point that this technology is the center mechanism for survival.