
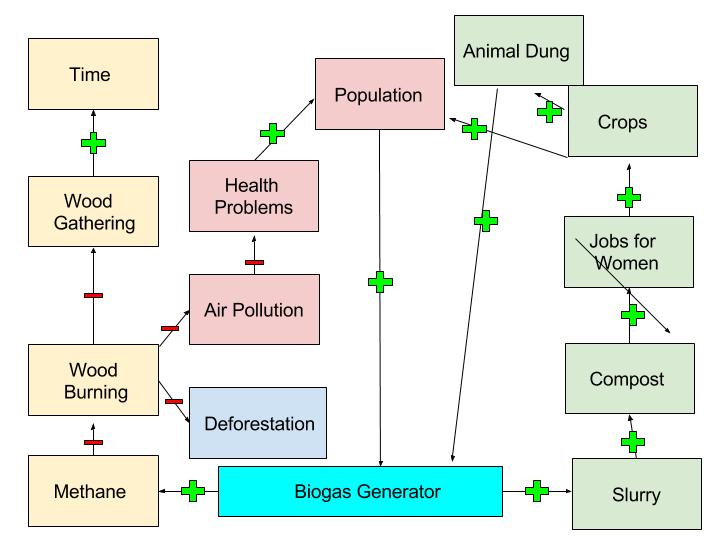
The main idea that my diagram illustrates is how a small village is impacted by a biogas generator. Through my diagram, one can see that the biogas generator gives off two different products, methane and slurry. Each product has a major impact on different aspects of every day life. Through the production of methane, there is a decrease of wood burning which leads to a decrease in wood gathering, air pollution and deforestation. With the decrease in wood gathering, there is an increase in time that the occupants of these villages have. The children have more time to go to school and do their homework and women have more time to work. With the decrease in air pollution, there is a decrease in health problems and an increase in population. Since there is an increase in population, more people are able to move to the city and help make biogas generators. With the production of slurry from the generator, there is more compost being created. With this compost, women are able to package it and sell it to farmers. with this compost, the farmers are able to grow more crops. Since farmers are able to grow more crops there is an increase in the population. Also a product of the crops is more animal dung, which fuels the biogas generators.
Looking at the Marten model of biofuel generators in India I see some similarities but many differences. When looking at Marten’s model, I can see that we both connect some points on each side to one another, as well as to the biogas generators.We both describe how it leads back to the generator. While we both describe it, we do it in different ways. I take the path of the products that come from the generators while he physically separates them into the social and ecosystems. In his model, Marten uses words to describe what is happening between each of the examples. In my model, I use plus and minus symbols to describe a positive and negative feedback look. The organization of each can lead to different outlooks on each model. From the comparison, one can see how exactly one leads to another through the words on the Marten model. It’s easy to see and learn about the impacts on each system through each of the models. Although it’s not explicitly labelled on my model, the social system and ecosystem are laid out in the exact same ways. Through these models, we can see the benefits the biogas generator has on each village and how it is set out to change life in India.
Hi Joelle, my name is Megan and I’m a architect undergraduate here at Penn State. Your simple (architect’s love simplicity, so I mean this as a compliment) way of indicating how one component interacts with another by means of plus or minus symbols makes your diagram easy to understand and really caught my eye. If you’d like to compare diagrams, here is the link to mine: http://geog030.dutton.psu.edu/2016/01/24/module-2-biogas-diagram-by-megan-shrout/
I thought very similarly about the generator, being so integrated between the separated environmental and social systems that I almost positioned it in the center as you have. Your color coding I find to be a little confusing and would’ve liked to see an indicator or key to help read it more clearly. Although you show your understanding of the systems and their interactions, the diagram itself doesn’t demonstrate your knowledge as well as your description. For example, it indicates that wood burning lessens deforestation, where as you would need to use a plus symbol between the two components.
I believe, in comparison to Marten’s diagram on the subject, yours is more focused on the generator itself and in turn shows the products of the generator as well, where Marten’s is an overall approach to this system. It shows how a slightly different perspective really changes the way we examine things.
I will be interested in seeing more of your work in weeks to come.
Joelle,
I like your use of + and – to show the effects between the different points on your diagram. It made it easy to follow. The color coordination was also an attribute of your diagram that I thought was helpful and enjoyed.
-Sam
http://geog030.dutton.psu.edu/2016/01/27/module-2-biogas-samantha-luchansky/
Joelle,
A very interesting diagram. I like the way you “Categorized” each interaction with either a “+” or a “-“. This allows the viewer to “Read” the overall impact of the interactions at a glance. I appreciate that approach, as the theory of positive and negative impacts as described in the module is not exactly what we usually think it is. Good work!
Mike Evangelista
http://geog030.dutton.psu.edu/2016/01/27/module-2-effect-of-biogas-generators/
Hi Joelle,
My name is Jordan. I enjoyed your representation of the System Diagram and how you displayed the negative and positive relationship amongst the cross interactions between social and ecosystems. I also think adding different colors to your text boxes as well as colors to postive and negative signs helps convey the various separations in your intention. I do wonder if you could have incorporated more cross interactions between certain categories instead of being so “flow-chart” related. However, I do appreciate the easy readability and clear intention in your representation. Thanks for sharing. If you get a chance, check out my diagram as well. http://geog030.dutton.psu.edu/2016/01/27/jzd5496_systemdiagram/
Thanks!
-Jordan