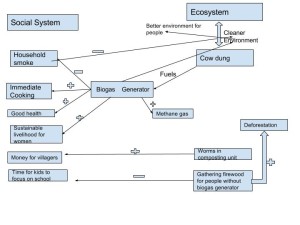
My systems diagram shows how the innovative biogas generator produces a coupled human- environment interaction. Cow dung taken from the environment and used as fuel for the generator overall produces a better human, social system. When humans use the generator to cook they are not using a wood fire smoke technique that would produce harmful pollution into the environment. Therefore, again, the cow dung from the environment is a way that the environment is impacting humans, and then humans are making a positive impact back on the environment.
One symbol I used throughout my diagram was plus and minus signs. The minus sign represents the word less or shows a reduction. For example less household smoke produces a cleaner environment. The plus sign represents more so another example: people that will gather firewood for their wood fire, that don’t have a biogas generator, will cause more deforestation. I tried to represent every aspect of the environment or social system that the video described. The ultimate goal of a picture like this would be to show people that a biogas generator has a positive feedback loop. Once other people see how positively the generator is impacting the environment it will lead to more people using the generator, as D Vidya Sagar plans on building an additional 50,000 generators.
My diagram reflects the one in “What is Human Ecology,” in the way that myself and Marten have both made separate columns to classify components of the social system and the ecosystem. Both diagrams show how each system relies on the other system. I tried to make my diagram less cluttered by using the plus/minus symbols whereas Marten described what his arrows represented in more depth. He also described how the generator would benefit poor vs. wealthy people, whereas I focused on how it could benefit people in general. With two different comparisons of the generator there is more opportunity for other benefits of the generator to arise that one author might not have realized.


Hi Victoria here is a link to my blog post https://wp.me/p3RCAy-b4V. I like how you separated the social system and ecosystem in your diagram. The diagram is easy to follow using the “+” and “-” symbols. One thing I thought was interesting is how you included the worms that are being used in the compacting unit and how the villagers are able to make money. The diagram was well done and you explained it well.
Hi Victoria. I noticed that we both chose to split the diagram into social systems and ecosystems. Additionally, we both opted to use +/- signs to denote positive and negative effects, which I believe are more succinct and visually appealing than small phrases. I am impressed that you were able to add so many aspects of the system into your diagram and still make it aesthetically pleasing. Overall, your diagrams accomplishes its goal of showing the positive feedback loop created by the biogas generator. If you would like to reference my diagram, you can find it here: http://geog030.dutton.psu.edu/2016/01/27/module-2-james-sharer/
Hi, I like the ideas that you presented in your diagram. I thought it was a very good idea to add the plus and minus signs on the lines connecting the different parts of your diagram. It makes it easier to read and understand over other possible options. In my own diagram I simply wrote out what the line was supposed to mean. Here is a link to it (http://sites.psu.edu/geog30/2016/01/27/module-2-kevin-hosterman/)