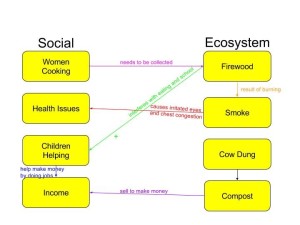
The core ideas behind my system diagram is that everything in the ecosystem help the people live their daily lives. Something in the ecosystem either benefits or hinders the people. For example, children must collect firewood for their mothers so sometimes the children miss eating meals, doing their homework, or miss school. Cow dung is something that would benefit the people because it is better for the air and their health rather than them using firewood which causes smoke and can hurt their health. Firewood and cooking in my system diagram is the use of a positive feed back loop. My example is the children collecting the firewood. They must collect and keep collecting the firewood for their mothers so they can cook. It’s a continuous loop of collecting firewood and then cooking with it. If they want to continue to cook, they must continue to collect firewood.
Comparing my graph with Gerry Marten’s graph in “What is Human Ecology?” is that they both include the same categories, social system and ecosystem. They are the same because they are both showing ways that the ecosystem impacts the social system around it. They are different because of the wording used in each category. We do not have the same topics in each square. Some similarities are we have similar ecosystem categories. For example, we both have how animal dung is used for cooking fuel. Differences are the categories themselves. He has ones that I did not include in my diagram. Something that can be learned by the comparison between the two diagrams that we might not have otherwise learned is how similar the diagrams can be when dealing with the same topic. Everyone has their own twist on their diagram, but for the most part the same point gets across.


Hi my name is Mara Bunting and I am study Early Childhood Education at Penn State UP. I looked at your diagram and ours are very similar! I also drew my diagram by comparing the social and environmental effects of biogas. The idea of smoke causing health issues was also an idea in my diagram. I didn’t include Cow Dung creating compost in my diagram but, I think that is a great idea to add! If you want to check out my diagram, here is my link: http://geog030.dutton.psu.edu/2016/01/27/module-2-coupled-human-environment-systems-2/
Hi Katelyn! Here’s a link to my blog! https://wp.me/p3RCAy-b9o
I read through your post and our diagrams are different, but it looks like our explanations as far as how society impacts the environment were the same. I really like how you included smoke as a category in your diagram. It really is something that could have been used to explain both the negative health affects as well as the air pollution. If I could go back, I probably would have added that as its own category, too!