Biogas System- Madison Halbom

Biogas System.mbh

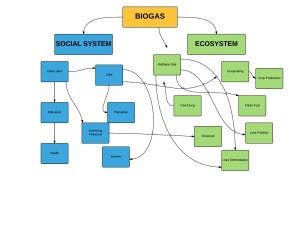
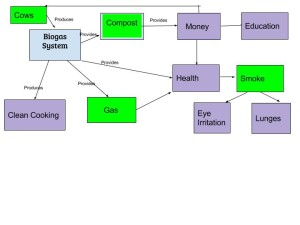
My diagram is focused very much on the sustainability of an environment and how closely coupled the environment and human interaction is with it. When looking at my diagram you can see that the Biogas System is able to function based on the usage of cow feces. Then it is shown that the system from there produces Compost, gas, and clean cooking which are all differently related to the environment and being produced by a human made system. Another concept that my diagram is based off of is the idea of feedback mechanisms. The biogas mechanism is only able to sustain itself through the production of cow feces and cows are only able to maintain life while the villagers have the means to feed and care for them so this creates a positive  feedback loop because by the more feces feces being produced the more money is made and the more cows are bought to produce.

My diagram compared to Marten’s  is similar in the ideas of what is produced and the feedback system ideas but differs in the fact that he was able to separate the social system and the ecosystem into to different areas but still had them connected in major ways. Our diagrams are different because in creating the diagrams I had a specific system that I was working with while he had general concepts. This made mine a little more messy to distinguish which system each box would belong to. What can be learned from the differences is that you are able to classify clearly black and white in some cases but in others a lot of times the ideas and categories tend to be intertwined with one another.

Module 2-Jason Brown

Untitled document (3)

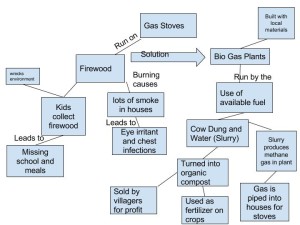
My diagram shows what the original problem was and how it was solved to help the community. It started off with the stoves. The people were worried about the negative impacts that the smoke had on their health and how damaging it was to the environment. Trees had to be taken down for firewood and the kids were missing school to help their mom cook so they could eat. Then, a positive feedback loop was created with the introduction of the biogas system. People started to recycle cow dung which polluted the village and turned it into usable methane gas. This not only stopped the killing of trees, but it lead to no more smoke. Also, the leftover mixture could then be used to fertilize the fields and sold to other local villagers for profit. Now because of this, there will be more waste in the future. Profit will rise. There will be more jobs to keep this running. The loop will keep going and the village’s health will greatly improve.


The diagram that the book showed had very specific terms just like mine did. I tried to put mine into social and ecosystem like the book and it kind of worked. We both connected everything together and showed how one box lead to another.The main difference is mine not having as much info as the books. I could have connected more items. These similarities and differences exist because we both looked at this system in different ways. We saw how different activities connected to each other. We can see how the bigger issues break off into smaller subtopics by looking at these diagrams and see the true drivers of the system.

Biogas System Hollabaugh

Biogas_sch5183

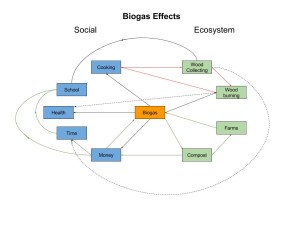
This diagram demonstrates the social and ecosystem effects that the introduction of biogas induces. The arrows indicate how one component interacts with another. For example, biogas produces compost, which can be sold for money, and used for farming. The diagram shows three positive feedback loops (green) and one negative feedback loop (red). One example of a positive feedback loop is that biogas produces compost, which is used on farms, which in turn make more biogas. The negative feedback loop is produced when biogas is introduced. normaly cooking requires wood burning, which requires wood collecting. When biogas is introduced this need for wood burning decreases, which means the need for wood collecting also decreases. Both the wood collecting and burning had adverse affects on schoolwork, time, and health, so the negative feedback loop has a positive effect on the system. When comparing this diagram to figure 1.5 in the Marten reading, it can be noted that there are many differences. This diagram breaks down the social aspects into health, money, time, cooking, and school work, while figure 1.5 uses a broader range of the human population. Figure 1.5 does not clearly show the social benefits such as improvement to health like this figure does, which is something that can be learned by examining both figures. They do use very similar concepts however, which is what makes them similar.

Biogas Concept Map- India

biogas_sxs5748

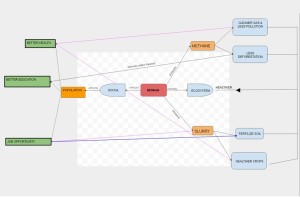
The provided system diagram that I’ve made is relatively simple to what other students might have and also from Marten’s diagram. What I’d like to show in the diagram were mainly how the biogas technology impacts both the ecosystem and the social system of the part in India which applies the biogas system. This invention produced two major products; methane gas and slurry. Both of these outputs brought various effect to fore-mostly the ecosystem, then affecting the social system as well. The production of methane gas leads to less environmental pollution and also reducing deforestation due to the people having an alternative energy choice for cooking. This in return will benefit the people health-wise and allow the children to go to school instead of gathering fuel. The slurry, on the other hand will help local farmers to fertilize their soil and grow healthier crops. At the same time, the slurry provides a certain group of the population (mainly women) with job opportunity by processing them into fertilizers to sell to farmers. Both the farmers and the women will gain economic profit from this.

For the most part, this diagram is much simpler and straightforward than that of Marten’s. It is similar in a way that both charts are divided into two major divisions- social system and ecosystem. Also, this diagram shows the effect that all outcome from the ecosystem side eventually leads to a healthier ecosystem, which isn’t shown in Marten’s diagram. Comparing the two diagrams, I think we could all learn more from the more complex relationships appearing on Marten’s illustration because he listed along the products and processes that goes along in the exchange of points such as cooking fuel, cut wood or put in biogas generators.

jzd5496_SystemDiagram


Dodderer_Biogas

The system diagram above conveys the Human-Environment System by displaying the vast interactions of the social system and ecosystem within the biogas revolution in India. The diagram shows both the positive and negative impacts of the technological development of biogas culture. The wood burning culture had created poor health effects due to wood burning, it forced child labor for collecting firewood, and caused deforestation. The new biogas culture allowed for a cleaner environment, less health effects, and less deforestation. It also created new jobs and wealth which allows the human population to flourish.

In comparison with the Marten system diagram there are similarities and differences. Both the Marten diagram and my own showcase the various interactions of the Human-Environment system. They display the affects that human decisions have on the environment and the way the environment affects human decision making. They differ in that Marten has more specific cross interactions between the two. Mine could have used more wording in the cross between to be more complete. I think these similarities and differences help to showcase where one puts emphasis on certain decisions and where others may be overlooked. I think it is important for things to be analyzed from more than one perspective so that we get a more complete picture of the interactions from a research perspective.

Module 2: Biogas in India

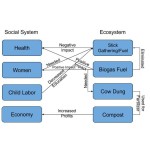
My system diagram presented shows the effect how the new and old ways for cooking has on the social system and the surrounding ecosystem. The arrows show the impact on that particular topic. The diagram shows the positive and negative aspects for using each fuel source. The negative impacts shown are related to using sticks for a fuel source by decreasing health and using child labor. The biogas fuel shows the positive impacts on the social system and ecosystem. The biogas fuel eliminated the need for child labor and has less health concerns. Also, the biogas fuel has helped their economy by selling compost that was made from the waste of the biogas food to the local farmers for fertilizer. This diagram also shows the biogas fuel has more resilience over the old fuel by, not having to depend on sticks and child labor.

When comparing my diagram to Figure 1.5 in the “What is Human Ecology?” article, there are similarities and differences. Both diagrams highlight the components of the social system and ecosystem. Also, both have the same general idea of the human-environment system and how they impact each other. Both show the different components of the biogas fuel and uses of its byproducts. The differences of the two diagrams is that in the Marten’s diagram, it uses the overall population, where in mine, I broke it down into the women and the child labor aspects. Comparing the two diagrams showed how there can be different perspectives and interpretations. Both diagrams highlight the main concepts that were discussed during the video.

Biogas Diagram-Sophia Greene

biogas_diagram_slg326

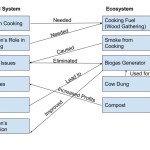
In my diagram I illustrated the relationship between the social system and the ecosystem. One core value of my diagram shows the effects cooking had on the village. Cooking took a toll on the environment, the health of the villagers, and the children’s time for their education. All of those effects from cooking are shown in my diagram. Another core value of my diagram focuses on the biogas generator and the effect it had on the village. Using the natural resource of cow dung to power the biogas generators, the collection for wood was no longer necessary and smoke was no longer a by-product of cooking. The biogas generator was not only a solution to all of the problems previously faced by the village though. The biogas generator also created an opportunity to make money and fertilizer for the villagers by using the compost. These outcomes are also illustrated in my diagram. Like Merten, I set up my diagram in the same layout, with social systems on the left and ecosystems on the right. However, Merten included the outcome the biogas had on trees, shrubs and plant residues, while I focused on other effects the biogas generator had. Our diagrams were different because we focused on different outcomes. Because these differences exist, the two diagrams show the wide range of effects the biogas generator had.

Biogas_Tenaya Mulvey

biogas_tqm5269(jpeg)

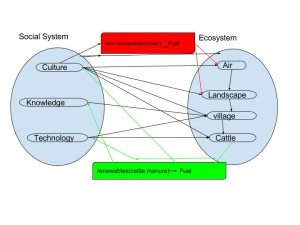
The main idea behind my diagram is to show the social and ecosystem relationship between the renewable and nonrenewable resources used for biogas. It also shows the relationship the overall concept of the biogas system from the start of knowledge, culture and technology to the landscape, cattle, air and villages. The red lines display the negatives of using nonrenewable resources, trees. The reason that I put trees in the nonrenewable category is the villages use the trees for fuel. The need the wood from the trees to create a fire to cook etc. With the constant need for wood for fuel they are using the resources quicker than the trees can reproduce. This in turn causes a decrease in the population of trees in the ecosystem in the villages.

The diagram from “What is Human Ecology” and my diagram are similar in a way we showed the process of biogas from manure. The Big difference in mine and Marten’s was that his was a lot more advanced. I did not look into the science of the biogas, instead I chose to look at it from an environmental viewpoint. Marten’s diagram is a lot more technical and breaks it down even further than I did. He included the human population where I coupled it all together under culture. Something can be learned from mine that was not shown in his, the negatives of cutting the trees for fuel and the increase in knowledge and technology to create a better idea, turning manure into fuel.