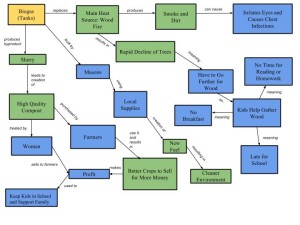
 The core ideas behind my diagram are to take a better look at the landscape in the sense of how the social and eco aspects of the Biogas (Tanks) are intertwined and to serve as an examination of their fluidity. To help simplify, I colored the Biogas (Tanks) box in yellow for a starting point; the ecosystem related boxes are green and the social ones are blue. All in all, I believe my system diagram done a decent job in demonstrating the human-environment interactions. My diagram in comparison to Gerald Marten’s is very different but with a few similarities. They are similar in that they both include (in one manner or another) fertilizer, crops, and the cutting of wood. They are different in that Marten’s diagram took the number of children in consideration and that they listed that the fuel was to be used for cooking – my diagram just has it listed as “New Fuel”. I believe one of the main reasons that our diagrams differ so much is the perspective we took. My perspective is more of a “big picture” and focuses on a little of everything, while Marten’s seems to favor the social/human side of the equation (albeit it in more detail). Having a second diagram to compare to allows me to view different interactions I overlooked when making mine: the gathering things to be buried, for example. Personally I believe that the more complete picture can be found using both the diagrams.
Biogas System Diagram (Module 2) – Bernstein
4
