
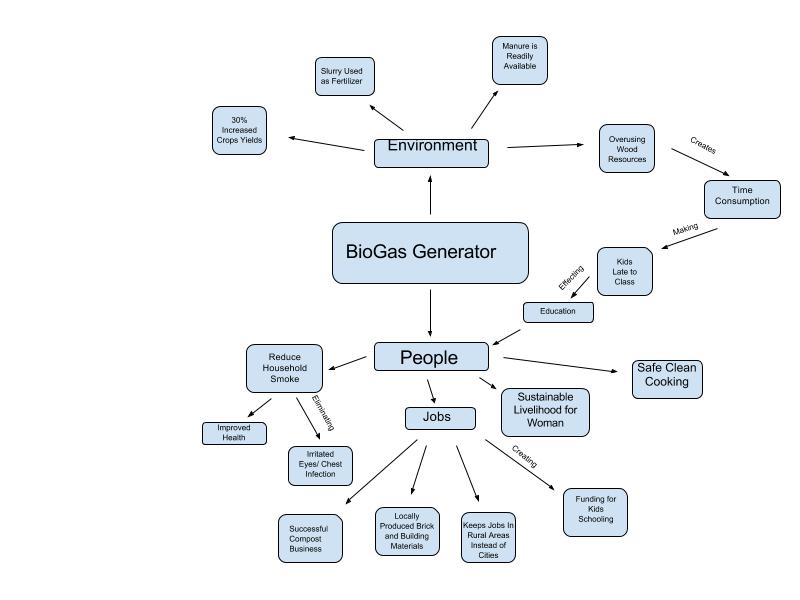
The core Ideas of my diagram are to show how BioGas generators are coupled Human-Environment systems. This is for two reasons, the first being that the generators are made and operated by man power; however, use natural waste from cows, people, etc. to create the methane gas product. The second is that it creates a positive feedback loop between the two as the cow poops which composts to makes methane gas for peoples use as well as fertilizer to increase crop production feeding the cows and thus making more dung. This is a system where the environment as well as humans rely on each other to better the ecosystem. My diagram is a different method then Marten because while his is an impact diagram showing directly how once thing leads to another and so on, mine is a component diagram showing how some effects are just pieces of another theme. The two diagrams are similar only in that mine follows a path of components that lead directly to the other part of the diagram showing a direct impact that the environment has on educational aspects of Indian kids. From this compare and contrast we can learn that while each method is different they both convey information about a certain topic, yet by incorporating some aspects of each types in to one it can help create a more powerful diagram.
Hi Nicholas, I find your diagram and description insightful and well-put. I included some similar aspects in my diagram, including breaking Biogas into two main categories: social and environmental. Here is a link to my blog: http://geog030.dutton.psu.edu/2016/01/27/module-2-4/. I also like how you implemented the idea of positive feedback loops into this diagram.