
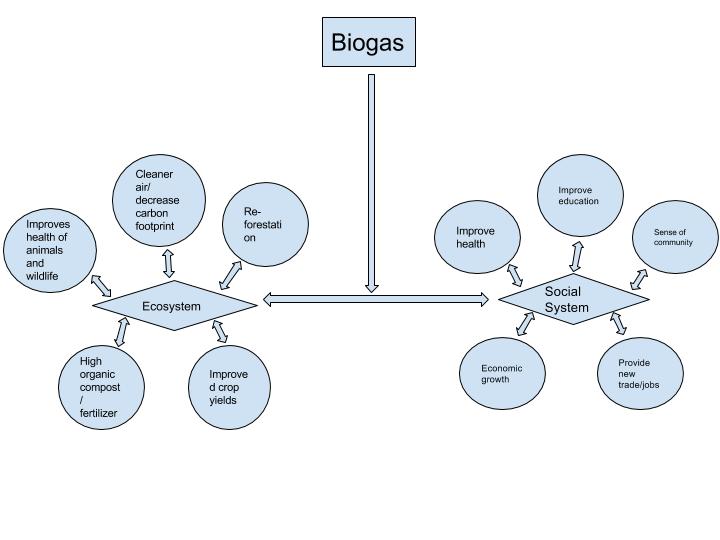
The diagram below displays the interdependencies of the ecosystem and the social system and how the usage of biogas technology has a positive impact on both. My diagram focuses more on the specific details related to the Biogas technology, where Gerry Marten’s diagram focuses more high-level aspects. There are a few similarities, between Gerry’s and mine. First is how the social and economic systems are ultimately interconnected. A change in one can impact the other. In addition, within each system the factors area also connected. Take Gerry’s diagrams for Social systems, he has lines from each impacted area. For example knowledge is connected to each concept, and with mine, I have double arrows from each area pointing back to the system, which is displaying that everything impacts the ecosystem and the ecosystem impacts everything. In addition, I have a two-way arrow in the middle, which demonstrates the connection between the social and the ecosystem, where Gerry’s diagram points out similar connection of how human activates impact the ecosystem, and the ecosystem services ultimately impacts the social system. Comparing them both together we can learn the relationship between the two systems and how they depend on each other. A change or impact whether it be positive or negative ultimately can impact the other.
Hi Kristen. My name is Adam Abbott and I am a senior in IST. I like your diagram because it is a different take on the subject than mine was. I made a diagram more similar to Marten’s, but you made yours differently and I think it is a little more clear. I like how you clearly show that the effects on the social and ecosystem aspects of the situation have a dual relationship. The social aspects of needing to cook with wood were also caused by other social impacts and you demonstrate that clearly. My diagram demonstrates more on the flow of the situation and how in the end it led to the decrease in usage of wood and the increase of jobs and education for women and children within the village. I think you did a great job showing the situation in a way I had not thought of.
If you would like to take a look at my post it is here: http://sites.psu.edu/geog30/2016/01/27/module-2-biogas-diagram-3/
Hi Kristen, your post sparked my interest because I notice that I included a lot of similar aspects of your diagram in my own as well. I also originally broke the main idea of biogas into ecosystems and social systems. Here is a link to my blog post: http://geog030.dutton.psu.edu/2016/01/27/module-2-4/. You are definitely right about how either negative or positive changes affects either the social or eco- system, which is portrayed in yours and in many diagrams for this.