
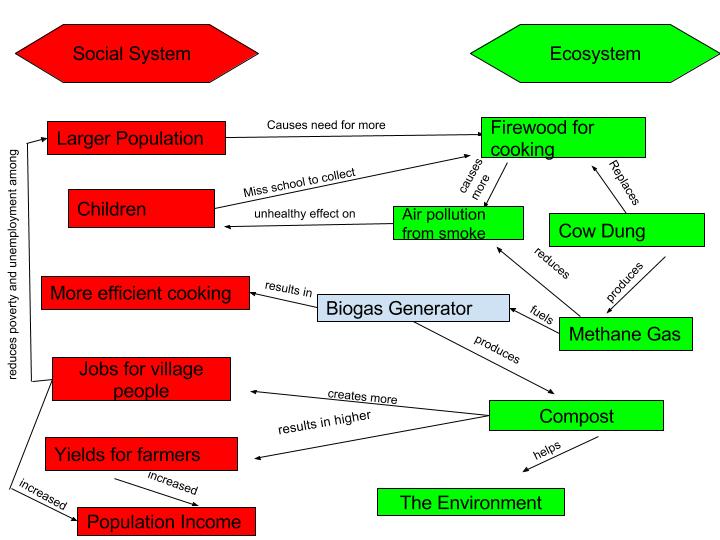
This diagram is intended to show both the environmental and social effects of the Biogas Generator in India. The two systems work as a coupled human-environment system in that they both impact each other in some way. My diagram shows the ways that certain human and environmental factors affect and are affected by each other. In many instances there are negative feedback loops like for example, the air pollution from the burning firewood has a negative effect on the health of the people. There are also positive feedback loops in this systems diagram. The compost from the Biogas Generator has a positive impact in that it creates jobs and income for the people in the village. The true driving force of this system is the size of the population in India. The increased population has caused deforestation and air pollution in the rural areas, which is essentially what drove the introduction of the Biogas Generator. In comparison to the Diagram in Marten’s “What is Human Ecology?”, my diagram has many similarities as well as differences. My diagram is slightly more specific than Marten’s in that it goes into specifics about the negative effects of the firewood as well as the positive effects of the compost produced. Similarly, both diagrams show how different materials are needed in order to use the Biogas Generator and therefore help the “population”. The reason there are similarities and differences among our diagrams is because everyone interprets the effects of different environmental and social factors differently. I might have thought something was more important to include in the diagram, while Marten could have assumed this was implied or unnecessary in displaying. By comparing the diagrams we are able to see multiple aspects of both systems that we might not have seen before. Seeing both diagram helps us to understand all elements that go into the systems and how they have different effects on one another.
https://wp.me/p3RCAy-b5y
Hi Cassie, my name is Shelby Epstein and I am a freshman at Penn State University Park! After looking at your systems diagram, I saw many similarities between yours and mine. Topics that we shared under the social systems side were larger population, children, efficient cooking, and income. Differences between ours was the amount of detail and information you put on your arrows. The more detailed notes that you used really helped me interpret what was being impacted. I also agree in that your diagram was more detailed than Marten’s and by comparing the diagrams, we were able to see many differences and aspects of both systems.
Hi, Cassie! My name is Melanie and I really liked your diagram for a couple different reasons. For one, I really liked how you color-coated your two separate columns. I thought that was a great way to understand your diagram. I also really liked how you put “Biogas Generator” in the middle to show the importance of it in the diagram. Something that I noticed we did in common was separate the two sides distinctly and connected them as needed. I thought your diagram was really well-done!
-Melanie DeFrancisco
Link to mine: https://wp.me/p3RCAy-b5D
Hi Cassie, I’m Ryan a Junior at University Park. A link to my post is here if you are interested. (http://geog030.dutton.psu.edu/2016/01/27/module-2-biogas/) Your system caught my eye because of the colors you used while I just used blue. Our two systems were similar in the fact that we both talked about children and how gathering wood takes away from their schoolwork. One way they are different is that I never mentioned cow dung, and I think it would of been helpful if I did since it is what fuels biogas. Overall I like you system diagram more then I like mine.