
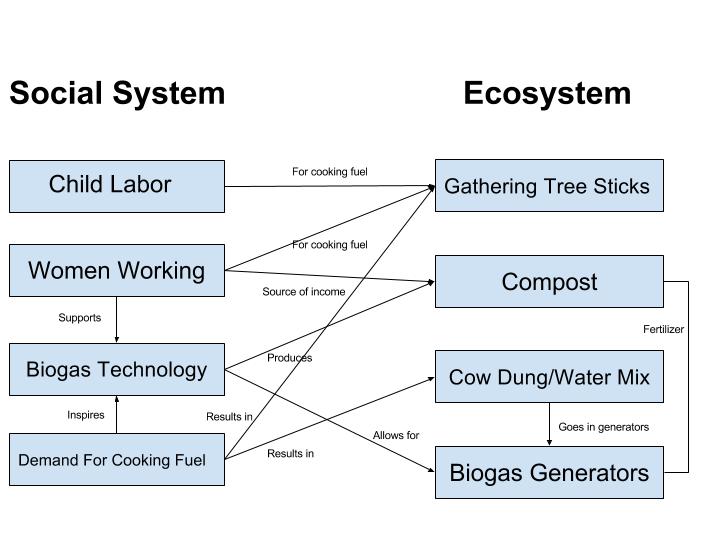
My systems diagram consists mostly of the material items/specific people instead of general concepts or a general group of people. I focused on how each essential part of this system reflects another. For example, gathering sticks is essential for cooking fuel, but also results in child labor. The Biogas Technology mixed with women working allows for another source of income with the compost they can sell. The compost comes from the generators, as a result of the cow dung/water mix. The mixture of dung/water stems back to another demand for cooking fuel. The reason I focused on the more material items is because the main issue is producing fuel for cooking. This issue is more thoroughly broken down through inspection of the materials and the people using them. I would say that my diagram is very similar to Marten’s 1.5 Figure with some subtle differences. We talk about most of the same ideas, but my diagram lists the specific items and people involved in the situation, and Marten generalizes topics such as, “Human Population,” or “Farm Fields.” Marten’s diagram also focuses mostly on how the ecosystem affects the Social System, whereas my diagram shows how the Social System interacts with the Ecosystem to produce a better more sustainable energy source. There are similarities because the issues are very eaasy to identify, and differences because everyone has a different view on them. A reader can learn from both of our diagrams that the biogas generators are very useful. They make it easier to produce gas to cook, while allowing the children to get an education instead of gathering sticks all the time.
Hi John, my name’s Lexie and here’s the link to my post:
http://geog030.dutton.psu.edu/2016/01/26/lexie-gersbacher-mod-2/
I like how you split up and labeled your diagram with Ecosystem on one side and Social System on the other, my diagram was divided the same way! I agree with you, that the issue presented is more thoroughly broken down through inspection of the materials and the people using them. Overall, your diagram was organized and very clear to follow!
Hi John. I’m Yuying Ren. I’m a sophomore studying Geography at Penn State. I like your diagram. It’s very clear and well-explained. You well summarize the elements mentioned in the video, and organize them into related system. We have similar components in social and ecosystem, and the way to show interaction is similar as well, while I don’t combine smaller elements into one component. Both of our diagrams are reasonable and persuasive.
This is my blog: http://geog030.dutton.psu.edu/2016/01/26/module-2-biogas-in-india-6/
Please come and have a look.
Hi John! My name is Amanda and here is a link to my blog post: http://geog030.dutton.psu.edu/2016/01/23/biogas-amanda-giedroc/
I thought your diagram was great! It was very neat and easy to read. Both of our diagrams discuss women working and how they can provide an income for their families through selling the compost. Additionally, I thought it was a great idea to try to connect everything back to the source of the biogas generators. It is important not to forget about the need for cooking oil as it is the main reason why the generators exist. Finally, both of our diagrams focus more on the social system side. I found it easier to make connections between the components of the social system!