
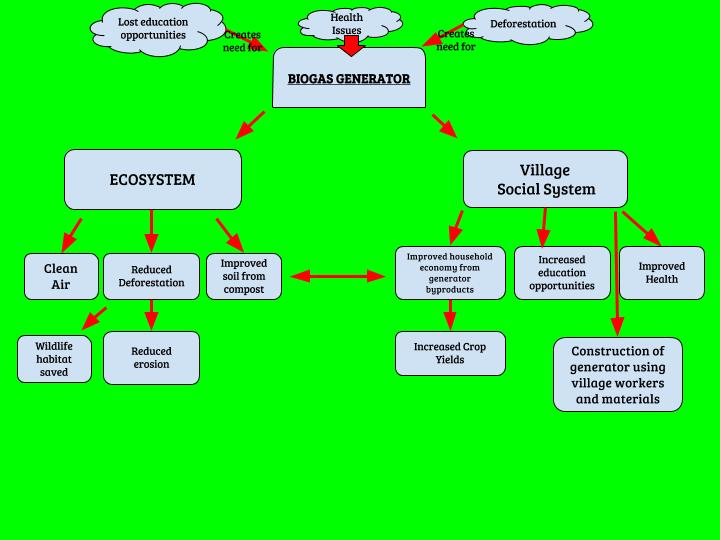
The core design behind my diagram was to illustrate the direct cause and effect of having a biogas generator in any small village. The effects (indicated by the arrows) have a primarily positive feedback benefiting both the local village social system as well as the local ecosystem. With proper construction and management of a biogas generator system, the resilience of both the village social system and the ecosystem in regards to the stressors and challenges related to fuel collection, lost educational opportunities, habitat loss, poor air quality and poor pulmonary health are substantially reduced. This system also has the potential to remain relatively stable if the same conditions of construction and management are met.
In comparison to the Gerry Marten diagram, both diagrams exhibit the same type of cyclical directionality. If something is changed in one system, it has the potential and likelihood to affect change in the other system. This can be referenced by observing the connection between deforestation and time spent collecting firewood (loss educational opportunities). The largest difference in the diagrams is both the perspective and scale at which we choose to illustrate the relationships. While Marten uses a more generalized distant approach, I chose to use a more localized, semi- specific approach. The similarities and differences can be largely attributed to scale. With comparison between the two diagrams you can easily see that the amount of change reflected in my diagram is truthfully only a small section of items affected by the addition of a biogas generator.
Hello, I’m Will. I chose to leave a reply on this article because the diagram reminded me of my own diagram. My diagram also puts the biogas generator at the center of the diagram with most of the arrows pointing towards or away from the diagram. I think this is effective because it shows how the biogas generator affects both the social system and the ecosystem. I also liked how you go from top to bottom with your diagram with the causes at the top. This makes the diagram easy to follow and shows a clear cause and effect relationship. I think my diagram is fairly similar and I have included a link to my post and diagram below. Thank you!
http://geog030.dutton.psu.edu/2016/01/24/william-graf-module-2/
Hello, I’m Brenton. The diagram you produced caught my eye because it seems as if it was developed outside of the Gerry Marten diagram. I attempted to do the same when creating mine. I did not review the Marten diagram until after mine was created to ensure I produced a system that was not heavily influenced on another that needed to be compared. We both came to similar conclusions. However, you detailed the added benefit of reduced deforestation. While I do not remember seeing this in the video, a little research coupled with common sense would have made this apparent.
Here is a link to my post:
http://geog030.dutton.psu.edu/2016/01/25/biofuel-brenton-mcdonald/
Hello, I’m Ashlee! Looking at your diagram has actually made me second guess mine. I put deforestation as a part of my environment section. I made it loop around to affect the social system but I like how you made it sort of like a reason to have the biogas generator and then included how having the biogas generator reduced deforestation. If you would like to take a look at my diagram here is the link.. http://geog030.dutton.psu.edu/2016/01/27/biogas-diagram/.. Thanks!