
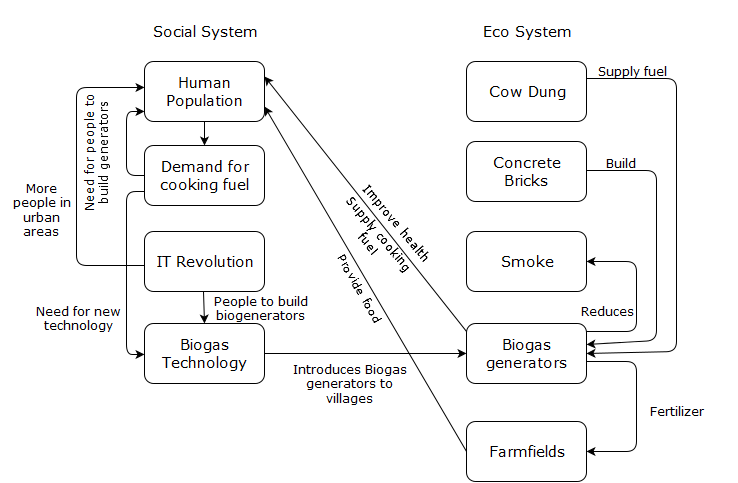
In my diagram, I visualized the different components of the village social system and ecosystem and how they interact with each other. Since the village represents a coupled human-environment system, studying it from a systems perspective would lead to a better understanding of the challenges facing it. One of the main ideas that can be inferred from my diagram is that the introduction of biogas generators can help bring a demographic transition to the village. Initially, the population would transition from high death rates to low death rates as biogas generators reduce smoke and improve population health. Then, the population would transition from high birth rates to low birth rates as biogas generators supply cooking fuel without using wood which reduces the requirement of children to collect wood.
My diagram is similar to Figure 1.5 in “What is Human Ecology?” in some ways. For example, they both portray the general feedback loop of how human population demands cooking fuel which leads to the use of biogas generators and then how biogas generators supply cooking fuel for the population. At the same time, they are different in other ways. For example, Figure 1.5 shows how trees on hills provide farm fields with irrigation water. Also, my figure shows how biogas generators reduce smoke and improve population health. I think these similarities and differences stem from the fact that different scales were used in both diagrams. In other words, my diagram focused on a village near Bangalore, India while Figure 1.5 focused on deforestation in India as a whole. As a result, I think looking at the problem with different scales can help us understand it more thoroughly.
Hello Omar, my name is Jake Segall. Here is a link to my post!
http://geog030.dutton.psu.edu/2016/01/27/42779/
First off, I want to say that your diagram is very well done. Not only is the organization of it put together well, but the language is simple, yet contains a lot of depth. The only thing that I might add, especially since you looked at this from the “effects on the village” viewpoint, would be something about the job impact. There are several places in your diagram that I think it would tie in very well, such as “IT revolution” or “concrete blocks.” Other than that, looks great! Also, wonderful discussion on the similarities and differences.
Hi Omar, my name is Amir and I couldn’t agree more with you on the fact that systems like these can really help us understanding these coupled systems clearly. I really like your diagram, it displays the benefits and cons coming from this system in a clear and direct manner, and it’s easy to follow along. I also think the biggest issue with projects like these is money and resource availability. India is the most populated country in the world, with one of the lowest GDPs out there, implementing something as innovative and advanced as this system can be a real issue.
Link to my post:
http://geog030.dutton.psu.edu/2016/01/27/biogas-system-diagram-2/