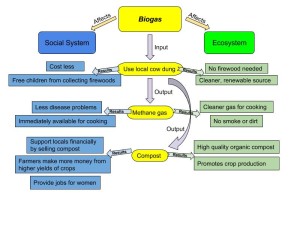
This image above is a system diagram for biogas in India, with system diagram, we can better understand the relationship between system’s components. In the diagram, we can see that how biogas affects ecosystem and social system, biogas generator uses locally accessible cow dung to produce clean methane gas, and the “leftover” slurry can be used as organic compost, which should be seen as a sustainable development since it doesn’t compromise the resources of the future generations. When comparing my diagram to the one in “What is Human Ecology?”, the same part would be that we both use arrows to show the effects, the different part would be that I use the procedure of producing biogas as a “tree trunk” and present the effects in two categories, but in the reading the author list the major topics under the two categories and find the relationships between the topics. I think the reason why we have differences and similarities is that we both know arrow can help us clear our thoughts and trace the chain of effects, but we have different ways to arrange the information. By comparing the diagrams, I think I would focus more on the correlation between different effects rather than just listing them under different categories, and I would also consider sing line arrows since it makes the diagram cleaner.
Tag Archives: biogas
Biogas System Hollabaugh
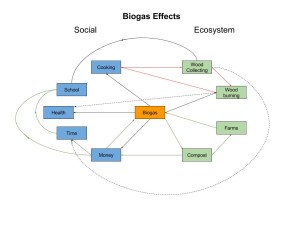
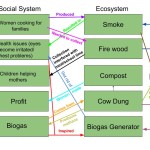
This diagram demonstrates the social and ecosystem effects that the introduction of biogas induces. The arrows indicate how one component interacts with another. For example, biogas produces compost, which can be sold for money, and used for farming. The diagram shows three positive feedback loops (green) and one negative feedback loop (red). One example of a positive feedback loop is that biogas produces compost, which is used on farms, which in turn make more biogas. The negative feedback loop is produced when biogas is introduced. normaly cooking requires wood burning, which requires wood collecting. When biogas is introduced this need for wood burning decreases, which means the need for wood collecting also decreases. Both the wood collecting and burning had adverse affects on schoolwork, time, and health, so the negative feedback loop has a positive effect on the system. When comparing this diagram to figure 1.5 in the Marten reading, it can be noted that there are many differences. This diagram breaks down the social aspects into health, money, time, cooking, and school work, while figure 1.5 uses a broader range of the human population. Figure 1.5 does not clearly show the social benefits such as improvement to health like this figure does, which is something that can be learned by examining both figures. They do use very similar concepts however, which is what makes them similar.
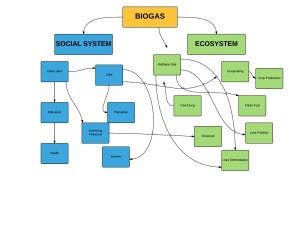
Ben Ceci – Biogas Concept Map
Image
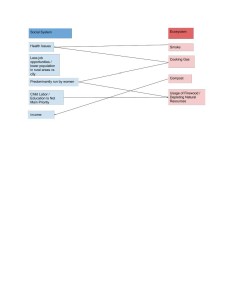
My diagram illustrates the factors involved in the social system and the ecosystem. After watching that video, I was intrigued on the process of creating the biogas and thought that it was very interesting. On the social end of it, I feel as though the main focus should be on health issues and that income should be the least important because if the process is not safe, it does not make sense to continue this process. As far as the ecosystem goes, the smoke was my biggest concern because it can directly affect the health of those involved, especially the women and children. What I found least important was that they were using up the firewood and natural resources.
When comparing my diagram to Marten’s diagram in “What is Human Ecology?”, one thing that immediately stands out is that we both use the same social system and ecosystem categories. While our categories are the same, our subcategories are not. Marten’s diagram focuses on broader ranges of categories while mine are more specific to the biogas process. One thing that I learned from comparing the two diagrams is that even though Marten’s diagram is focusing in on a broader topic, and mine is more specific to the biogas process, they follow the same format. This shows that when dealing with the same categories, you can expect to have similar results, no matter how specific you get.
Biogas System Diagram (Module 2) – Bernstein
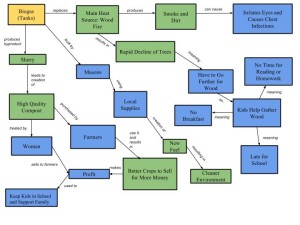 The core ideas behind my diagram are to take a better look at the landscape in the sense of how the social and eco aspects of the Biogas (Tanks) are intertwined and to serve as an examination of their fluidity. To help simplify, I colored the Biogas (Tanks) box in yellow for a starting point; the ecosystem related boxes are green and the social ones are blue. All in all, I believe my system diagram done a decent job in demonstrating the human-environment interactions. My diagram in comparison to Gerald Marten’s is very different but with a few similarities. They are similar in that they both include (in one manner or another) fertilizer, crops, and the cutting of wood. They are different in that Marten’s diagram took the number of children in consideration and that they listed that the fuel was to be used for cooking – my diagram just has it listed as “New Fuel”. I believe one of the main reasons that our diagrams differ so much is the perspective we took. My perspective is more of a “big picture” and focuses on a little of everything, while Marten’s seems to favor the social/human side of the equation (albeit it in more detail). Having a second diagram to compare to allows me to view different interactions I overlooked when making mine: the gathering things to be buried, for example. Personally I believe that the more complete picture can be found using both the diagrams.
Kyle Hoke BioGas System
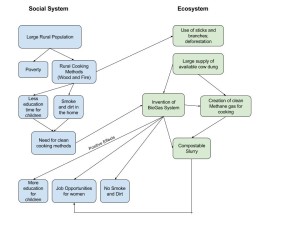
The core idea of my diagram is how a large rural population still using old, harmful fire and wood cooking methods led to the birth of the BioGas system shown in the video, and then the positive effects the system has on the social systems of rural India. The system creates a positive feedback loop, as it causes more performances because of its actions. It creates more time for children to gain an education, a clean cooking environment, and more job opportunities for the women that sell the fertilizer that is composted from the leftover slurry. This seems to be a very sustainable system as well, as it leaves more vegetation for the cows to eat (rather than it being used as a cooking fuel) and produce the waste needed to run the system. It is also a very stable system because there is very little to disturb the underground BioGas system. Compared to the diagram in Figure 1.5, they are the same in the way that the population creates a demand and need for the new technology. They are different because my diagram includes the results of the biogas generators, and Figure 1.5 relates the result of cooking fuel right back to the population. The diagram in Figure 1.5 organizes the nodes in ways that creates larger loops so the process can repeat itself. It is good to compare to see not only how an expert analyzes the system, but to see things that may have been missed. For example, the use of animal dung and plant residues not only helps fuel the biogas generators, but it is used for fertilizer too. Therefore, the more that is used in the generators, the less there is to create fertilizer to create healthy farms, although the resulting slurry from the biogas generator helps to create fertilizer as well.
Module 2 Jonah Kim
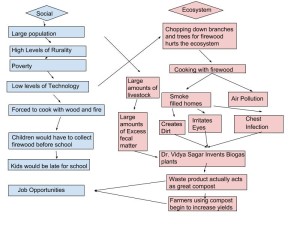
As we learned in the module a large population will have a large effect on the environment. This is evident in India, where the country has such a large population so not everyone can fit inside the modern, technology centered cities. So they have to cook with fire and wood. Because of this children would have to collect firewood before school so their mothers could cook. This caused many kids in rural areas to be late or even entirely miss school and miss out on their studies. On the other hand in the ecosystemthe kids and mothers chopping down trees and hurting the ecosystem. Then with the wood fires children and mothers would negatively affect health. So Dr. Vidya Sagar realized he could take the excess cow manure to create a biogas plant. Another benefit is that the remaining product acts as a very good compost and so women who use gas stoves and biogas plants can also make money selling the remains for compost. So like in “What Are You Optimistic About? Why?” by Ray Kurzwell, technology could evolve to help reduce impact. My diagram is similar to Marten’s diagram through the content. Everything he’s talking about I talk about as well just more specifically in each square. I, however, do not have as many connections between social and ecosystems. It could be learned that their are a lot more connections between a social system and an ecosystem than we may initially think.
jzd5496_SystemDiagram
The system diagram above conveys the Human-Environment System by displaying the vast interactions of the social system and ecosystem within the biogas revolution in India. The diagram shows both the positive and negative impacts of the technological development of biogas culture. The wood burning culture had created poor health effects due to wood burning, it forced child labor for collecting firewood, and caused deforestation. The new biogas culture allowed for a cleaner environment, less health effects, and less deforestation. It also created new jobs and wealth which allows the human population to flourish.
In comparison with the Marten system diagram there are similarities and differences. Both the Marten diagram and my own showcase the various interactions of the Human-Environment system. They display the affects that human decisions have on the environment and the way the environment affects human decision making. They differ in that Marten has more specific cross interactions between the two. Mine could have used more wording in the cross between to be more complete. I think these similarities and differences help to showcase where one puts emphasis on certain decisions and where others may be overlooked. I think it is important for things to be analyzed from more than one perspective so that we get a more complete picture of the interactions from a research perspective.
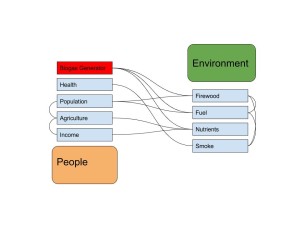
I used a couple key concepts from module 2 to help me construct this system diagram. Biogas production in rural India affects the people and environment there in many ways. Utilizing the biogas generator utilizes technology to increase the carrying capacity of the system. When using exclusively firewood for fuel, the people had one resource that could be depleted. Technology allows people to use a waste product to increase the available fuel for cooking and heat. I highlighted the biogas generator in a different color because it is the main driver of change in this example. Once biogas generation is possible, Firewood collection is reduced and people spend less time gathering it. Fuel is produced from the generator which reduces the polluting smoke of firewood, and gives people an efficient form of energy. The generator also produces usable nutrients which reduces pollution to the environment and produces income. The nutrients also boost agricultural production which again gives people income and more food. The addition of the generator to the system increases the stability of the system because there are fewer inflows and out flows. My diagram is similar to Marten’s in that there are two main interaction categories of humans and the environment. My diagram is different because it is more focused on the effect of the generator than the overall cycle. There are similarities because the purpose of the biogas generator is to effect the dynamics of the social-environmental system. It shows that these are complex systems and it is hard for a systems diagram to simplify it to just a couple interactions.
Module 2_Joseph Carlamere
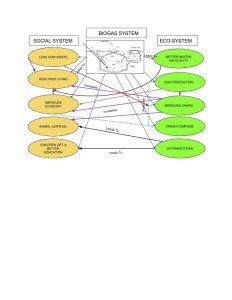
The biogas video shows the coupling of the human-environmental system and the interactions between humans and the environment. To display the interaction in my system diagram, I listed the components of the social system and the eco-system that have a direct interface with one another than dug a little deeper to identify the non-direct collaboration. To start, by installing a biogas system removes cow dung from the community. This will improve the overall health of the people living in the town; plus removing the dung creates compost, which leads to improved soil conditions resulting in increase agriculture. Another aspect of utilizing the biogas system is better indoor air quality inside the house. This is achieved by removing wood burning stoves and installing gas-burning stoves. A byproduct of this improvement is increased health. The biogas system has increased the local economy too; the women of the town are able to bag soil that is produced by composting. Additionally, local bricklayers are able to earn a living by building the top of the biogas container. Lastly, the children of the town are able to get a better education. The mornings usually consisted of gathering branches and wood; now they are able to attend school. One more interaction between the social system and ecosystem is reforestation and increase wildlife survival rate, which is achieved by not removing excess forestry to burn for cooking.
Reference:
“Coupled Human-Environment Systems.” Geographic Perspectives on Sustainability and Human-Environment Systems. Pennsylvania State University, 2016. Web. 26 Jan. 2016. <https://www.e-education.psu.edu/geog030/node/324>.
Module 2: Biogas in India
- System Diagram
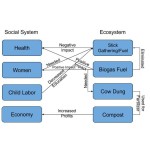
My system diagram presented shows the effect how the new and old ways for cooking has on the social system and the surrounding ecosystem. The arrows show the impact on that particular topic. The diagram shows the positive and negative aspects for using each fuel source. The negative impacts shown are related to using sticks for a fuel source by decreasing health and using child labor. The biogas fuel shows the positive impacts on the social system and ecosystem. The biogas fuel eliminated the need for child labor and has less health concerns. Also, the biogas fuel has helped their economy by selling compost that was made from the waste of the biogas food to the local farmers for fertilizer. This diagram also shows the biogas fuel has more resilience over the old fuel by, not having to depend on sticks and child labor.
When comparing my diagram to Figure 1.5 in the “What is Human Ecology?” article, there are similarities and differences. Both diagrams highlight the components of the social system and ecosystem. Also, both have the same general idea of the human-environment system and how they impact each other. Both show the different components of the biogas fuel and uses of its byproducts. The differences of the two diagrams is that in the Marten’s diagram, it uses the overall population, where in mine, I broke it down into the women and the child labor aspects. Comparing the two diagrams showed how there can be different perspectives and interpretations. Both diagrams highlight the main concepts that were discussed during the video.
Impact of Biogas Generators on Livelihoods of Individuals in India
The system diagram below represents the chain of effects that biogas generators have on the rural ecosystems in Bangladesh, India. The current problem people of this region face without a clean fuel alternative to wood burning is degradation of the land and health issues in young children and women. Biogas generators allow more time for children to go to school, improve living conditions and health, and create a compost product, which women utilize to generate income. The core ideas behind my diagram are the social, environmental, and economic factors that cooperate to transform biogas generator technology into sustainable livelihoods for women and children. I view an ecosystem as an interaction between the physical environment and human social system. Coupled human-environment systems show the impact of the relationships between the human social system and ecosystem.
Notice that the diagram is divided by color: blue (direct factors of biogas production) green (environmental effects), and red (social and economic benefits).Together the generator and women entrepreneurs reduce environmental waste, improve the lives of their children, and create a product that aids the farmers of rural areas.
Figure 1. Local impact of biogas generator in rural Bangladeshi, India.
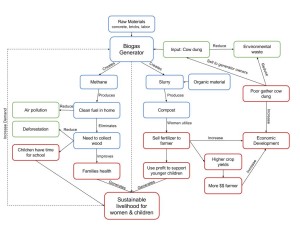 Compared to Marten’s diagram, this diagram has few similarities, but both pay attention to the environmental impact and demand for biogas generators. Marten’s diagram focuses on the larger social system while this diagram is specific to the livelihood of the individuals affected. There are similarities and difference between our diagram because we are concentrating on different scales. My diagram is a local scale while Marten’s focuses on a regional scale in India. It is important to compare diagrams to understand all the factors involved in systems. Each of us think critically about different elements of the system. By examining each diagram, we can learn a different point of view about the same system.
Anthony Russo India Biogas System Diagram
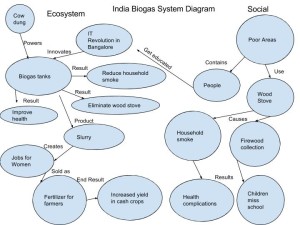
The whole problem or cause of this system diagram is that of wood stoves in homes of poor families. The wood stoves cause household smoke which can cause health complications such as eye irritation. Another negative effect of wood stoves is the time consumption associated with collecting firewood. Children are used to help find the wood which leads to them missing school. The IT revolution in the Indian technology capital of Bangalore inspires people to be innovative. People go there and get educated with new technology so they can bring their skills back home. This is a feedback loop because the education of the people is the consequence of them taking advantage of the IT revolution. People such as D Vidya Sagar, who came from a poor area of the country, used what he learned in Bangalore to invent biogas tanks to solve the problem. Biogas tanks use cow dung from the area to produce gas which is used in electric stoves. The waste product from these tanks make a compostable substance called slurry. This substance has created jobs for women of selling the surrey to farmers to use for fertilizer. The farmers believe surrey increases their cash crop yields giving them a better profit. In both system diagrams, animal dung powers the biogas generators. One difference is the positive impact the compost has on women. The two charts can be different due to location. We can learn how huge of an impact this technology has on the local people.
Module 2- Maura McGonigal
My diagram focuses on the story behind the creation and utilization of Biogas generators. The two main causes that triggered the implementation of Biogas generators are deforestation and negative population health effects from smoke based cooking techniques. The use of Biogas generators improved the social and ecosystem. The social system was affected by improving children’s quality of education and women’s quality of life. Since the generators provide methane directly to households, women’s cooking times are decreased, which enabled them to then take slurry waste from the generators and create fertilizer. This then affected the ecosystem by improving the quality of soil and increasing crop production.
When comparing my diagram to Gerry Marten’s diagram, I noticed one main difference. Marten’s diagram focused on all aspects of the social and ecosystem, where my diagram focuses on specific details within the social and ecosystem. I think it is important to be able to look at the system as a whole and encompass all the contributing factors. However, I also feel at times it is important to zone in on the direct effects on the system. Marten’s and my diagram showed similarities in how the social and ecosystem are intertwined through feedback mechanisms. This is an important concept because it shows how changes in the social system affect the ecosystem and vice versa. The similarities and differences in the diagrams arise from individual perspective. It is always important to consider others opinions because everyone has different life experiences, which lead to unique perspectives.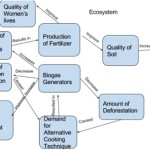
Biogas Diagram- Julie Cardillo
The core ideas behind my system diagram were to show the benefits of the biogas generator and the interactions between the social system and the ecosystem. The concept of landscape comes to mind when thinking about social system and the ecosystem of the Indian village. The main issue shown on my diagram was that women cooking had negative effects on the environment (i.e. wood collection caused deforestation) and even negative effects within their own system (i.e. health issues). The concept of biogas and the biogas generator solved those issues by using cow dung as its power source. This eliminated the demand to cut down trees for wood (deforestation) and the need for children to collect the wood. Also, my diagram shows how the women make a profit selling the compost from leftover cow dung. As long as the villagers cook with biogas, this village will most likely leave its resilience state and move onto being stable.
In comparison to Marten’s figure, mine is set up is similar. For example, we both show biogas in the social system and biogas generators in the ecosystem. However, it seems like he focuses on larger concepts (i.e. human population), while I focused on smaller concepts (i.e. women and children). I believe that the reason why there are similarities and differences between my diagram and Marten’s is simply because of perspective. In other words, Marten and I interpreted some aspects similarly, while other aspects he and I interpreted differently. What I think can be learned by comparing the two diagrams is that it is important to have multiple perspectives. The reason why is because by looking at Marten’s diagram, I was able to consider things that I probably would not have thought about prior to the comparison. As a result, I now have a better understanding of the linkages between the social and ecosystems shown in the movie.

