Module 2: Biogas: Samantha D’Aversa

biogas_diagram_sld5613

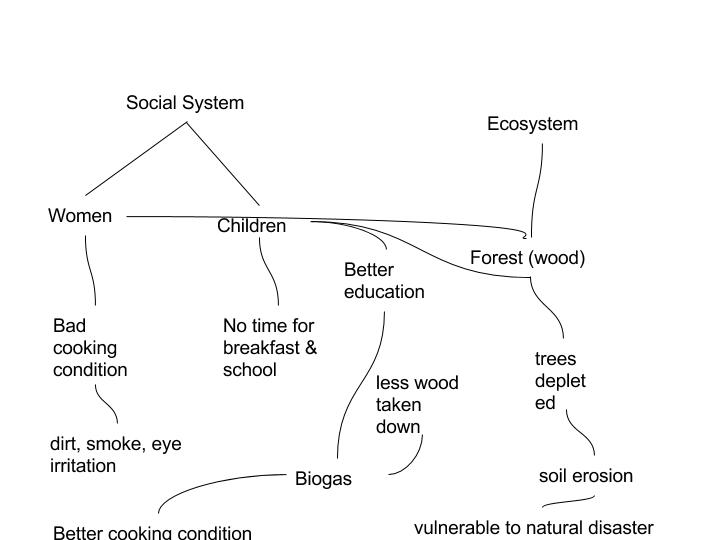
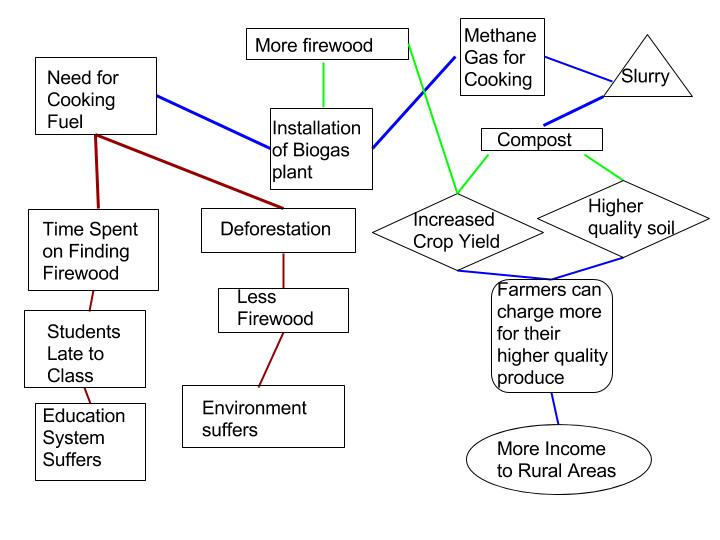
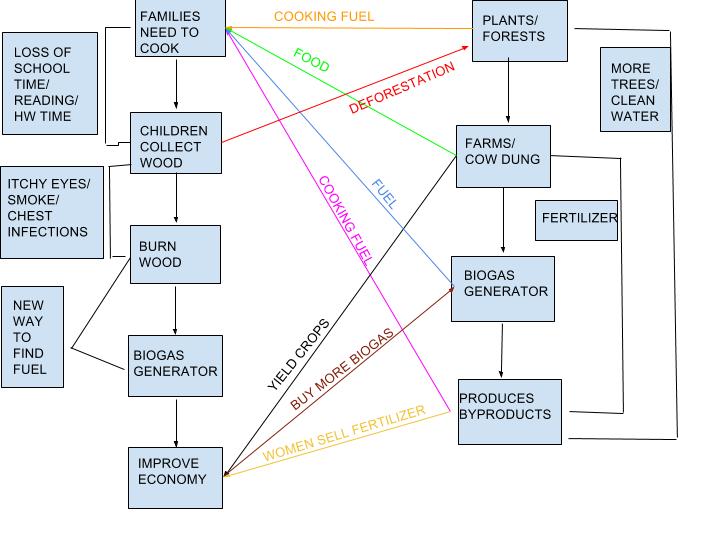
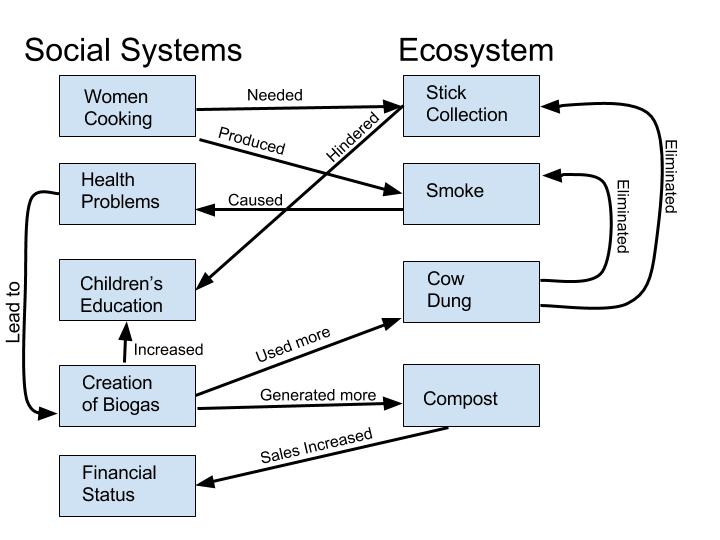
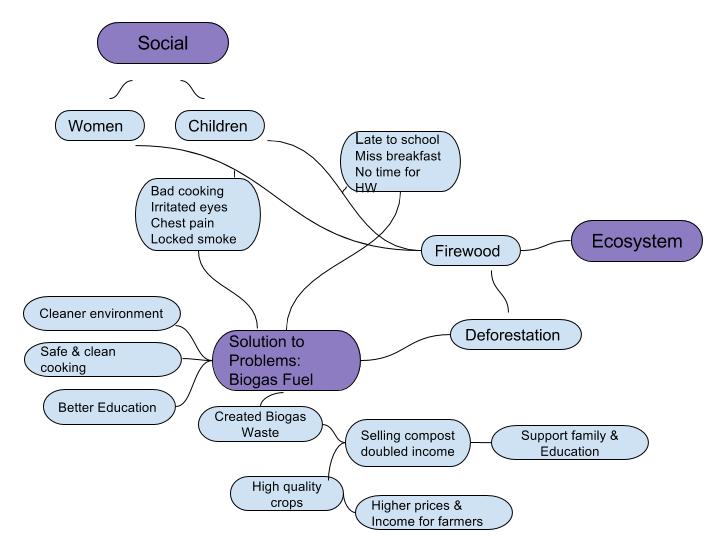
In my diagram I focus on how people use India’s resources to find a solution to the harmful problem of cooking on stoves. This relates to the concept in module 2, human-environment landscape, which displays how humans affect the environment and the environment affects humans. In this case the environment is negatively affecting society, more specifically, women and children. My diagram displays that women order their children to collect firewood which inevitably leads to children missing breakfast, being late to school, and not having enough time to do their homework, while also creating unsafe and unsanitary cooking conditions in the house. People suffer from irritated eyes and chest pains from the locked smoke in the house. To fix this danger the environment caused, experts decided to create Biogas Fuel Technology. This technology creates safer and cleaner cooking conditions, a cleaner environment, and allows kids to have time for their education. Additionally, this fuel creates waste that women use to sell to farmers to help support their family and education, doubling their income. This allows farmers to improve their crops and earn a greater profit. This is an example of human-environment landscape because society altered their environment to create a safer living.

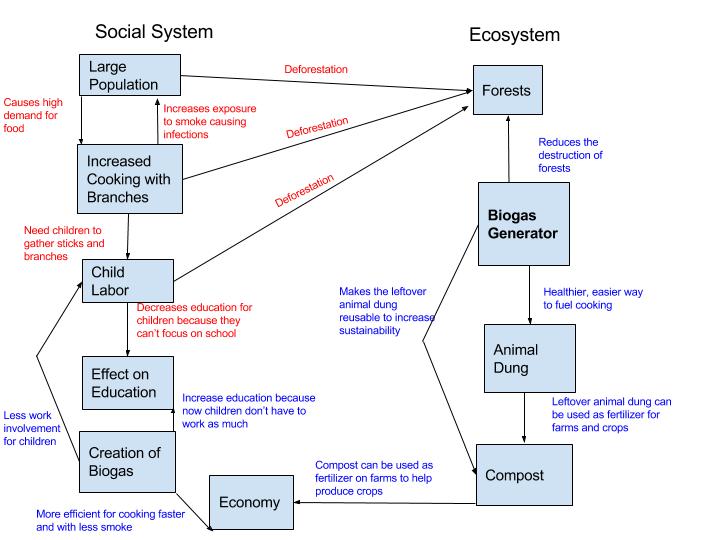
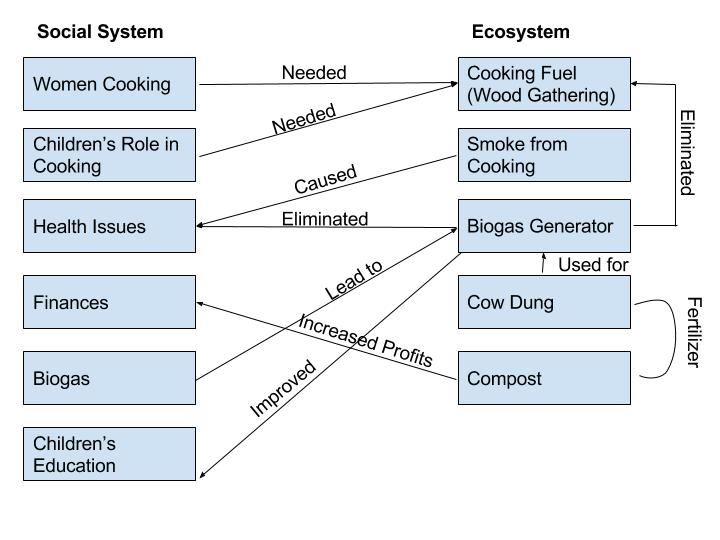
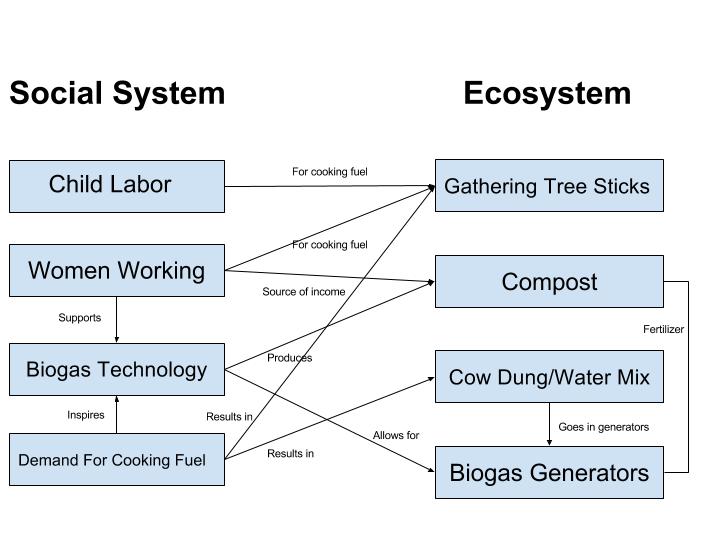
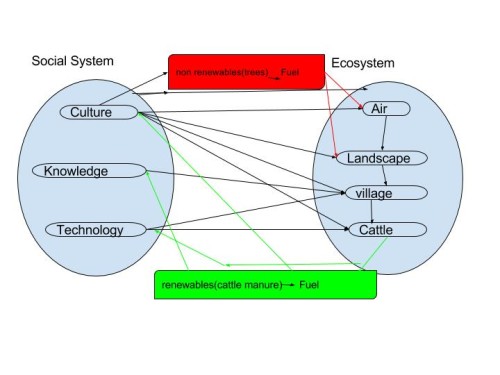
When comparing my diagram to Figure 1.5 there are a few similarities and differences. Even though Figure 1.5 displays a broader version than my diagram, both figures display how the social system affects the ecosystem and how the ecosystem affects the social system. However, Marten’s diagram focuses more on the population social ranking. For example the Marten explains the generators will mainly go to the wealthy rather than the poor, creating a wider gap between the two groups, which will not totally prevent the current problem of deforestation. On the other hand, my diagram focuses on how society as a whole is improving. Analyzing Figure 1.5 allowed me to have a different perspective on this concept, from seeing a different thought-process. I think that both my diagram and Marten’s diagram are correct, however, they differ due to different interpretations of the video.

Julie Hetu- Biogas Diagram

The core idea of my diagram is to simply express the effect that the invention of the Biogas Generator has on both the social system and ecosystem of this area in India. This diagram shows the numerous beneficial effects that the Biogas Generator has on the social system such as increases in finances, education, farming, and the decrease in health issues. After reviewing my diagram, it is easy to notice that the Biogas Generator creates many positive feedback loops. For example, the people in the village cook the food, produce waste which is needed for the biogas generator, which then produces compost and methane gas, which leads to increased farming and better health conditions. The increased farming increases finances which in return leads to more cooking, and the loop starts again.

Compared to Marten’s figure, both of the diagrams have the social system and ecosystem on separate sides which show the linkages between the two. The main difference between my diagram and Marten’s diagram is that mine shows the basic increases, decreases, and effects of the two systems on each other, but Marten’s has more description and doesn’t necessarily say the outcome of the linkages. There are similarities and differences between these two diagrams because everyone is going to have different interpretations and different views, but the similarities are going to be there because it is the same concrete information that is given. However, from looking at both diagrams, the main idea will be seen that a Biogas Generator is very useful to these villages in India.

Biogas_jlh6441

LearningActivity#2_wzz5097

biogas_diagram_wzz5097

The core behind this diagram is that biogas is a better solution for cooking fuel in India. First of all, human and the environment are closely coupled together. Before introduced to biogas. Women and children have to gather fuel wood from the forest, in which deplete trees, causes soil erosion and make the land more vulnerable to natural disasters ultimately. This create a positive feedback loop with negative effects. More woods gathered enable to feed more people, in which more forests got cut down. Women and children spending time gathering fuel, children don’t have enough time for their breakfast and school work, in which result in a worse health condition and education level. Women will be impacted with dirt and smoke created while cooking. Using biogas requires no wood, children get better education and people would be healthier. Comparing to the system diagram from Marten what is human ecology, both diagrams have main category as social system and ecosystem. Two-direction arrows suggest that these two are coupled to each other. Change in one would affect the other. The difference is that in my diagram, a new technology of biogas is introduced to the system. Thus changed some factors in both categories. For example, kids have more time studying and less trees are cut down. By comparing both diagrams, my diagram doesnt show the effect of biogas generator clearly. In Martens graph, reduced impacts are shown with dotted lines.

Caren Levin Module 2

The core values of my Biogas diagram are to visually express the powerful effect that Biogas generators have on the social system along with the ecosystem. The creation of Biogas technology has numerous beneficial effects on the environment and humanity, as opposed to cutting down trees to use as fuel for cooking. As shown on my diagram, the red comments indicate the negative effects that cooking using fuel from trees causes. Whereas, the blue comments represent the positive outcomes that Biogas generators cause which help to maintain sustainability. Instead of just burning trees and creating fuels that can only be used once, Biogas generators place waste through a rotting process allowing us to reuse animal dung as compost. This ultimately increases sustainable development.

When looking at Gerry Marten’s diagram 1.5, some similarities I noticed are that we both mention the social system and ecosystem and their effect on one another. For instance, we both listed human population as having a large impact on the environment. We all know that our population is what ultimately effects our demands, level of consumption and technology, therefore it makes sense that human population will have a large effect on our environment. However, one major difference I noticed is that my diagram focuses on the schooling and the child aspect of the social system. Families, who can’t afford the Biogas generator, have their children work by gathering branches and helping cook. Unfortunately, the time children spend finding branches limits the opportunity they have to do school work. I mentioned in my diagram how the Biogas generator doesn’t run on fuel from trees and therefore children don’t need to be working as much and can focus on school. Although mine and Marten’s diagram focus on different aspects of Biogas generators, together they show different ways to interprete the effects of a Biogas generator and how the social system and ecosystem interact in so many different ways.biogas_cel5304

William Graf – Module 2

Untitled document

I created my diagram with the core ideas that there needs to be a demand for change for change to actually happen. In this case there was a demand for new technology to change the use of firewood for cooking stoves in India. This demand was caused by the health issues from the smoke, and also the time required to gather the required amounts of firewood. These concerns can be shown in the social column of the diagram. The ecosystem demanded that firewood be replaced, because this area was running out of available firewood. These problems lead to the demand for the biogas fuel technology or the “Biogas Plant”. This technology solved the problem of the smoke and firewood issues in India, but there was still demand for higher income for women, and also a demand for higher crop quality. This sparked the addition to the biogas plant of being able to collect and sell the biogas sludge as a fertilizer. This then solved the problem of higher income for women, and also increased the crop quality in India. This core idea can be compared to the idea of population vs. carrying capacity. The demand for new technology to support larger and larger populations is constantly increasing. As this demand continues to grow so will the technology and therefore the carrying capacity will continue to grow with the population. I think this diagram is fairly similar to Marten’s but with the exception that his is much more broader. The diagram in this post is designed specifically for the biogas plant where Marten is a much larger scale. Both of the scales show how different aspects of social and ecosystems interact, and how different demands can lead to different technologies and knowledge.

Nick Gasparovich- Module 2 Learning Task

After creating my system diagram, I began to realize the entire system is a series of positive feedback loops. For example, the village people, local farms, and the biogas generator are connected in a positive feedback loop. The farms produces food for the village people, the people eat the food and produce organic waste, the waste is converted to cooking fuel and compost. The compost is then sent back to farms for more food to be grown, and the cycle starts again. With the biogas generator in the village, the act of growing food will produce more food since more compost will be formed. Village farms have reported that the biogas generator compost is giving the farm better crop yields. The Marten reading diagram and my own have very similar system components. At the same time the way they are organized is quite different. My diagram portrays all of the components as one giant ecosystem, while the Marten diagram suggests there are separate ecosystems (Human and natural) that have a few key connections. These differences prove what was stated in the module reading, people can look at ecosystems on many different scales. In this scenario I saw the village as one large ecosystem, while Marten say the people and the natural environment as two systems.  In my mind these two systems need each other to be successful, neither one is perfectly self-reliant. This also reflects back on the reading, both humans and the environment work together in mutualistic relationshipsbiogas_njg5224.

Biogas Diagram – Jared Mummert

Social System       vs.           Ecosystem

Module2JDM5805

People’s basic need for food has indirectly lead to the destruction of forests in India. People need some source of heat to cook their food, and up until recently the only source for heat in India was to burn firewood. Collecting firewood wouldn’t be a bad source of energy if it were only needed for a small amount of people, but with India’s population nearing 1.25 billion and growing this problem is becoming more and more dire. The growing population could be thought of as a positive feedback mechanism for forest destruction, because a larger population means more firewood required to help heat the food for the people. As firewood becomes scarce, more children are needed to collect the wood. This is a runaway feedback mechanism, often described as positive feedback.

In comparing my diagram to figure 1.5 in the reading, you will notice that there are many similarities, and also some differences. In both diagrams you will notice that the arrows go both directions, meaning there are cases where the social system effects the environment and cases where the environment effects the social system. This makes up a landscape, described as the combination of environmental and human phenomena that coexist together in a particular place on Earth’s surface. The main difference is that the reading’s diagram considered the farm fields and irrigation water more than mine. There were similarities because we both based our diagrams off of the reading, and there were differences because each individual will have different things come to mind when reading something due to creative differences. By comparing the diagrams, I learned that there were some things that I should have included in mine that I left out, but there were also some things that I addressed that the reading’s diagram did not.

Module 2 Biogas Diagram by Megan Shrout

biogas_mus306

This Village Social and Ecosystem Diagram visually separates each system into its main influential components and then to their own components. The diagram’s focus is on how cooking in rural India impacts the system. Demand for Cooking Fuel, for example, is broken down into the two “solutions” given in the video: BioGas technology and Wood Foraging. These two social components both effect their ecosystem differently. This shows how one component can create positive and negative feedback depending on how it approaches the subsequent result. Biotechnology reduces the need for wood fire to cook; wood foraging only supplies the fuel. Red lines help to differentiate a positive (additive) impact/feedback from negative (subtractive) which is indicated in green.

This diagram was extracted from one source, which shows a bias toward BioGas Generators as it disregards any unwanted effects they may incur (and therefore, the diagram does not display them). Gerry Marten’s diagram also disregards these aspects. His diagram responds more to the population as a number, and the influence cooking fuel demand increases it. My diagram adheres more to the educational repercussions than the number of rural children due to wood foraging for fire fuel. Marten’s diagram uses arrows to show the resources that one component provides to another, where as the arrows in mine indicate impacts.

Cody Rhodes Biogas Diagram and Explanation

Untitled document

The core idea here is to illustrate which practices are sustainable. Those practices marked with red lines are societal practices that are not ecologically sustainable. The green lines represent positive ecological outcomes/results and the blue lines represent societal practices that are sustainable. Using the practices marked by the blue and green lines, the stability of the interactions between human society and the natural (non-human) environment increases. The blue and green lines also depict a positive feedback loop, ending with increased income for the rural communities, which will lead to more of these communities installing biogas plants. The diagram is similar to that in our reading that it contains aspects of societal need and ecological factors. The diagrams differ in scale, and Marten’s diagram depicts society and the environment as two separate entities, but it is my belief that the two are so closely related I shouldn’t divide them thusly. Perhaps another, more concrete reason for this difference is the broad scale Marten’s diagram uses juxtaposed with the small-scale, acutely specific scale presented in this module. To me, it seems that my diagram would interact between both parts of Marten’s.

Biogas Diagram-Sophia Greene

biogas_diagram_slg326

In my diagram I illustrated the relationship between the social system and the ecosystem. One core value of my diagram shows the effects cooking had on the village. Cooking took a toll on the environment, the health of the villagers, and the children’s time for their education. All of those effects from cooking are shown in my diagram. Another core value of my diagram focuses on the biogas generator and the effect it had on the village. Using the natural resource of cow dung to power the biogas generators, the collection for wood was no longer necessary and smoke was no longer a by-product of cooking. The biogas generator was not only a solution to all of the problems previously faced by the village though. The biogas generator also created an opportunity to make money and fertilizer for the villagers by using the compost. These outcomes are also illustrated in my diagram. Like Merten, I set up my diagram in the same layout, with social systems on the left and ecosystems on the right. However, Merten included the outcome the biogas had on trees, shrubs and plant residues, while I focused on other effects the biogas generator had. Our diagrams were different because we focused on different outcomes. Because these differences exist, the two diagrams show the wide range of effects the biogas generator had.

Biogas–Amanda Giedroc

SOCIAL SYSTEM                ECOSYSTEM

biogas_arg5492

In my diagram, I wanted to focus on the coupled human-environment interactions in more detail. For example, I thought it was important to discuss the effects of picking up wood on education and deforestation. By looking at the systems in more detail, I noticed some positive and negative feedback loops. In terms of the economy, biogas generators produce fertilizer which the women in the town can sell. Due to the increase in money, more families can buy more generators, leading to even, more money (positive feedback loop). On the other hand, biogas generators push families away from picking up branches, leading to a decrease in deforestation (negative feedback loop). As I compared my diagram to Marten’s in the reading, I noticed we had some things in common. We both discussed farms, forests, fertilizer and cooking oil. However, in my diagram, I focused on the problems associated with health, education, and the economy. Additionally, we differed as I did not have branches discussing the human population and how generators could affect the number of children families had. There are similarities between our diagrams because we both mentioned crucial points about the purpose and significance of biogas generators. However, there are differences because I spent more time breaking down the relationships in great detail while Marten made the important broad connections. By comparing the two diagrams, viewers might not have thought about how biogas generators can increase wealth (economy) for women and farmers in the town.

Biogas Diagram- John Windt

Biogas Technology (1)

My systems diagram consists mostly of the material items/specific people instead of general concepts or a general group of people. I focused on how each essential part of this system reflects another. For example, gathering sticks is essential for cooking fuel, but also results in child labor. The Biogas Technology mixed with women working allows for another source of income with the compost they can sell. The compost comes from the generators, as a result of the cow dung/water mix. The mixture of dung/water stems back to another demand for cooking fuel. The reason I focused on the more material items is because the main issue is producing fuel for cooking. This issue is more thoroughly broken down through inspection of the materials and the people using them. I would say that my diagram is very similar to Marten’s 1.5 Figure with some subtle differences. We talk about most of the same ideas, but my diagram lists the specific items and people involved in the situation, and Marten generalizes topics such as, “Human Population,” or “Farm Fields.” Marten’s diagram also focuses mostly on how the ecosystem affects the Social System, whereas my diagram shows how the Social System interacts with the Ecosystem to produce a better more sustainable energy source. There are similarities because the issues are very eaasy to identify, and differences because everyone has a different view on them. A reader can learn from both of our diagrams that the biogas generators are very useful. They make it easier to produce gas to cook, while allowing the children to get an education instead of gathering sticks all the time.

Biogas Diagram – Jessica Moritz

jmm6447 biogas

My systems diagram shows the interactions between social systems and ecosystems.  I started with women cooking and how this all lead to the creation of biogas.  The simple act of cooking was leading to environmental destruction, by collecting wood, limited kids’ education, since they spent a lot of time collecting sticks, and causing chest infections because of all the smoke.  This diagram shows all these interactions and then how the creation of biogas solved these problems.  The creation of biogas is an example of a positive feedback loop because an initial change lead to multiple outcomes.  For example, biogas lead to more production of compost which the sales of this increased income for the women of the society and this cycle would keep going as the use of biogas increases.  Similar to Marten’s Figure 1.5, I categorized social systems and ecosystems on separate sides of the diagram.  I think this way is to better organize what the diagram is trying to prove.  Ours is different because he also focused on how the compost can lead to food for the human population; I think he focused on more outcomes than I did.  I think by looking at both Marten’s and my diagram, a reader could see how society was before and after biogas.  I focused on problems not having biogas was causing and he focused on what happens after biogas is brought into the world.

Biogas_Tenaya Mulvey

biogas_tqm5269(jpeg)

The main idea behind my diagram is to show the social and ecosystem relationship between the renewable and nonrenewable resources used for biogas. It also shows the relationship the overall concept of the biogas system from the start of knowledge, culture and technology to the landscape, cattle, air and villages. The red lines display the negatives of using nonrenewable resources, trees. The reason that I put trees in the nonrenewable category is the villages use the trees for fuel. The need the wood from the trees to create a fire to cook etc. With the constant need for wood for fuel they are using the resources quicker than the trees can reproduce. This in turn causes a decrease in the population of trees in the ecosystem in the villages.

The diagram from “What is Human Ecology” and my diagram are similar in a way we showed the process of biogas from manure. The Big difference in mine and Marten’s was that his was a lot more advanced. I did not look into the science of the biogas, instead I chose to look at it from an environmental viewpoint. Marten’s diagram is a lot more technical and breaks it down even further than I did. He included the human population where I coupled it all together under culture. Something can be learned from mine that was not shown in his, the negatives of cutting the trees for fuel and the increase in knowledge and technology to create a better idea, turning manure into fuel.


Coupled Human-Environment Systems – Erica Golden

Screen Shot 2016-01-22 at 3.20.47 PM

When drawing my diagram, my core idea was to focus on the ideas of resilience and sustainability. Specifically, the notes of the biogas generator helping the women become independent money makers and the compost producing improved yields both with help increase the social system and ecosystem resilience and sustainability in any area where the biogas generator is used as it should.

I think my diagram is remarkably similar to the figure in the Marten reading. The gathering of cooking fuel drove the key elements on both the social system and ecosystem side of my diagram. I think my diagram breaks down the human population/impact piece more specifically. If I had space in the diagram or if more subtext was asked for, I would have broken down the responsibilities and outcomes to the women in that community into more detail, as well as emphasized the negative outcome to the children (mainly their education). I think there are similarities because the Marten diagram is a well-constructed one about the same topic and I think mine is different because of the perspective and history I bring to the assessment, notably the additional attention I gave to women and children. In comparing the two, I think that I could have spent more time looking at the common factors between the major components. I am clearly more comfortable keeping contributing elements in their unique categories, where the Marten diagram has more connection points.