Module 2 Learning Activity- Victoria S.

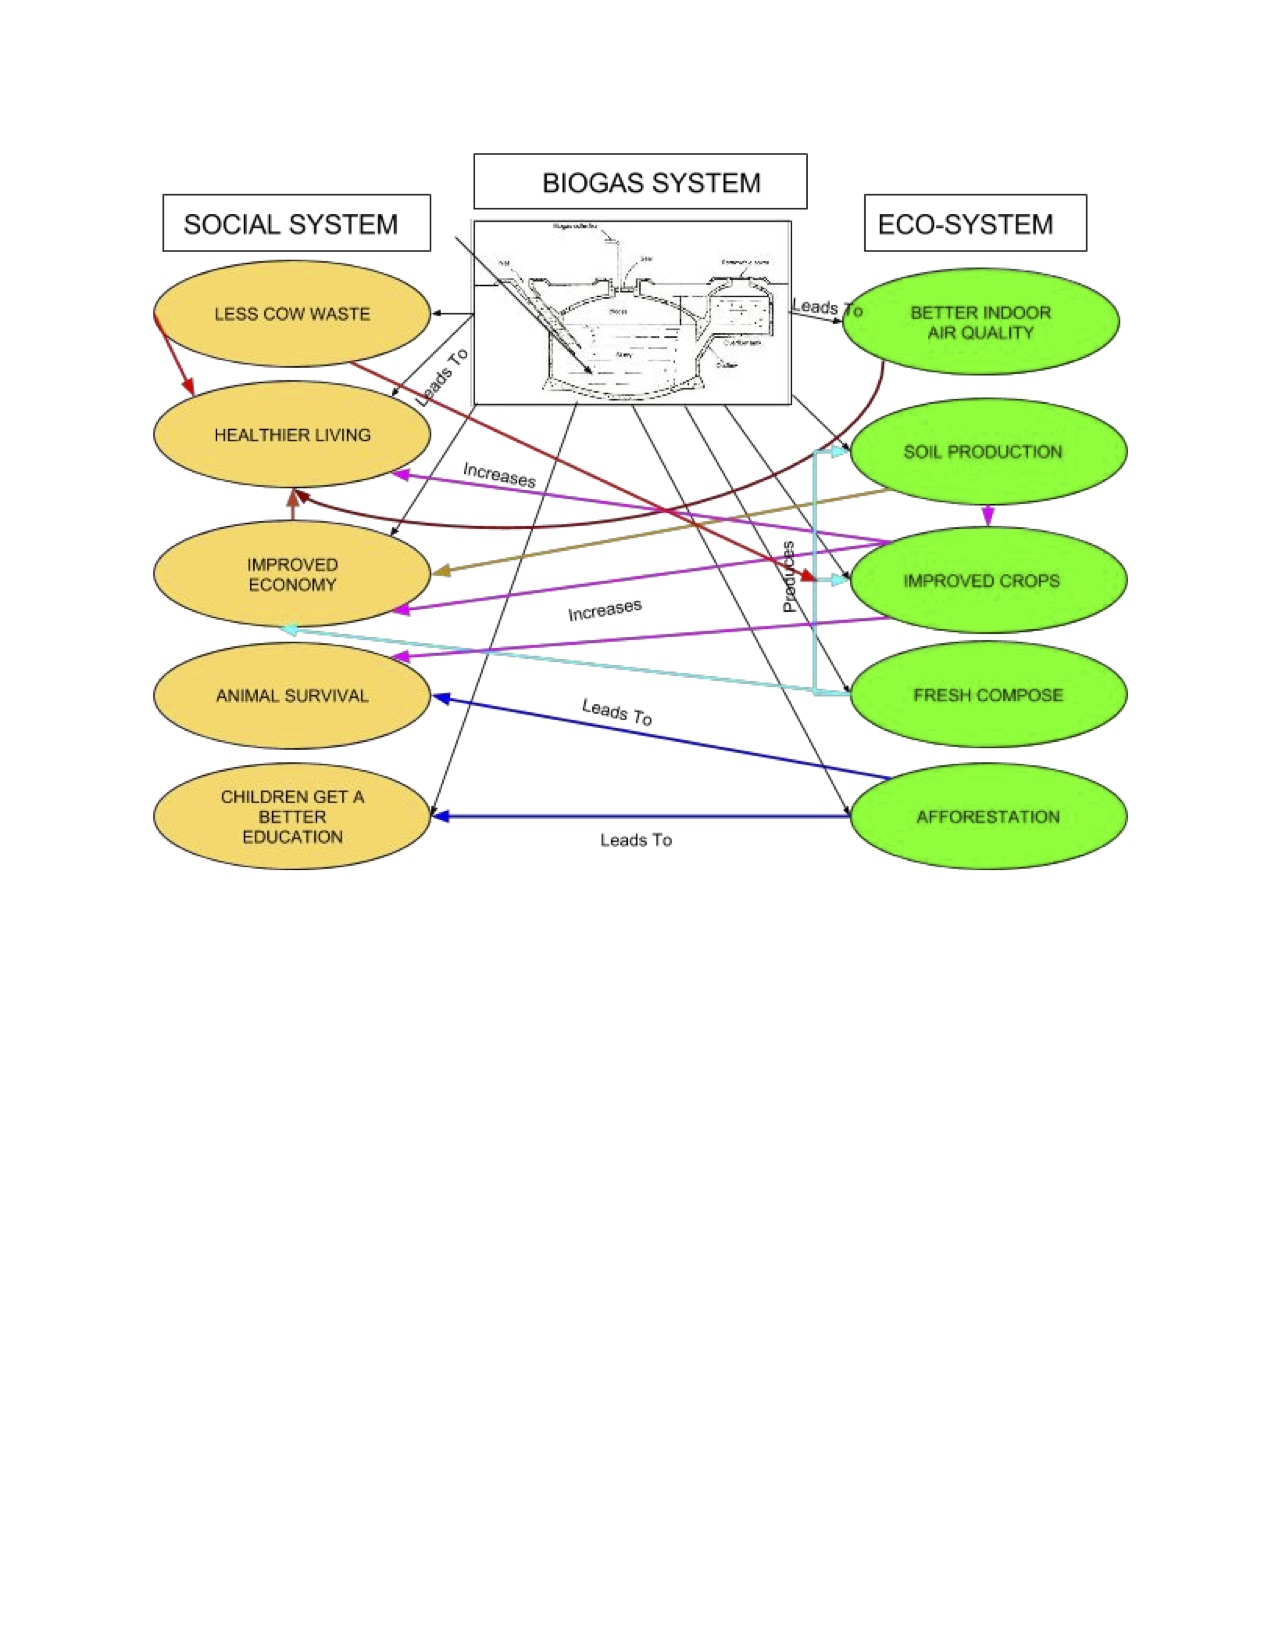
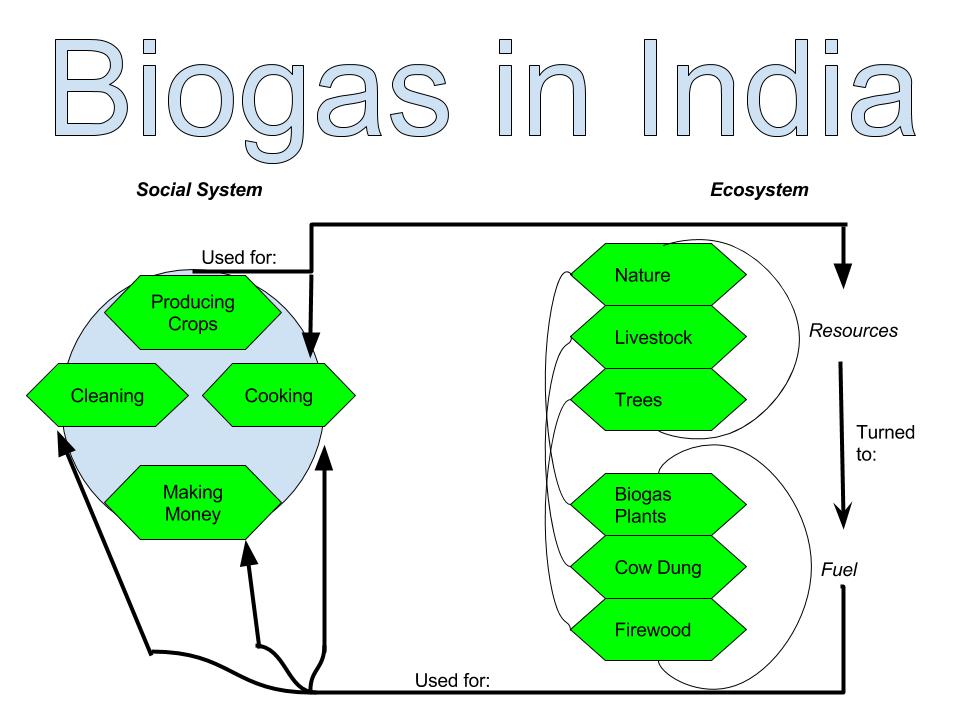
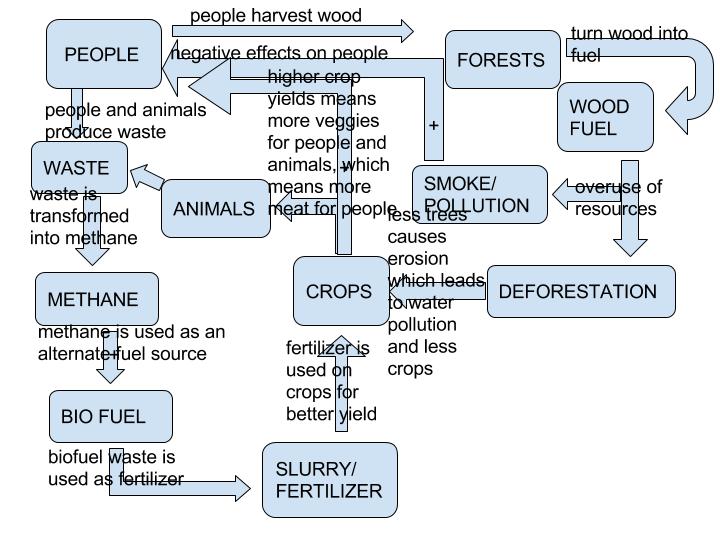
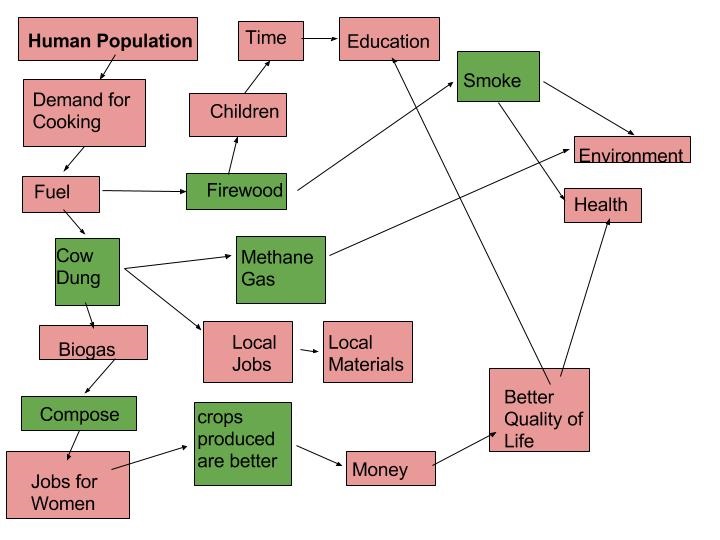
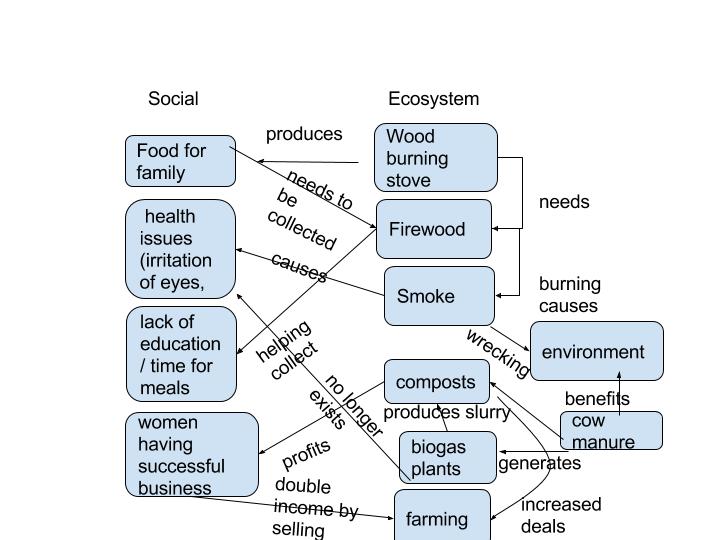
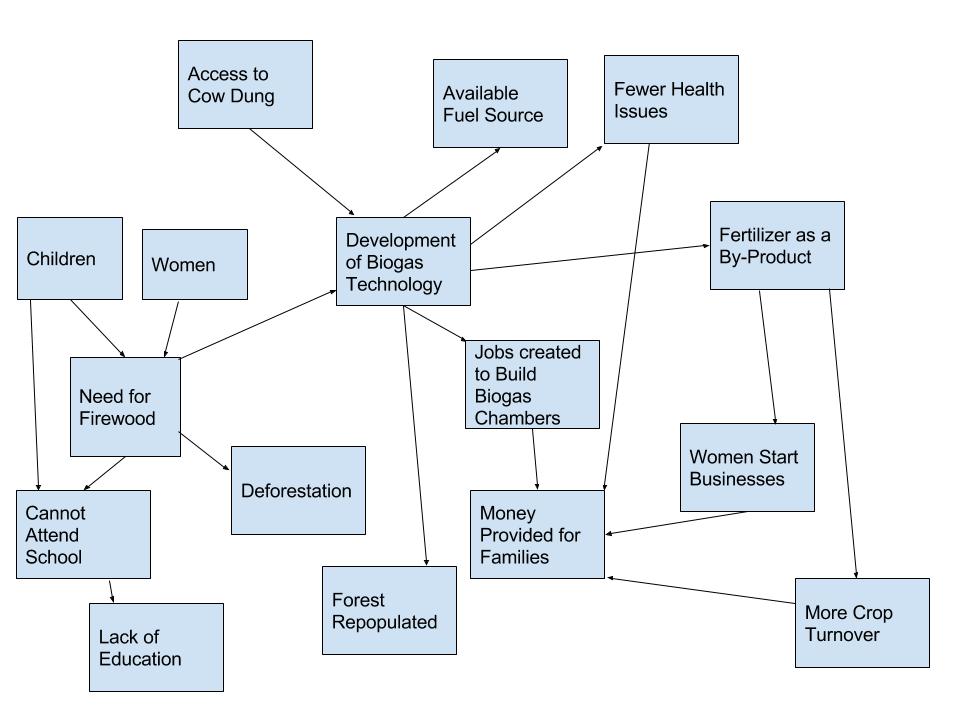
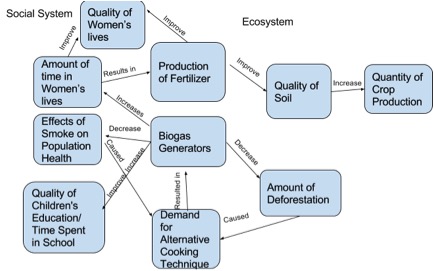
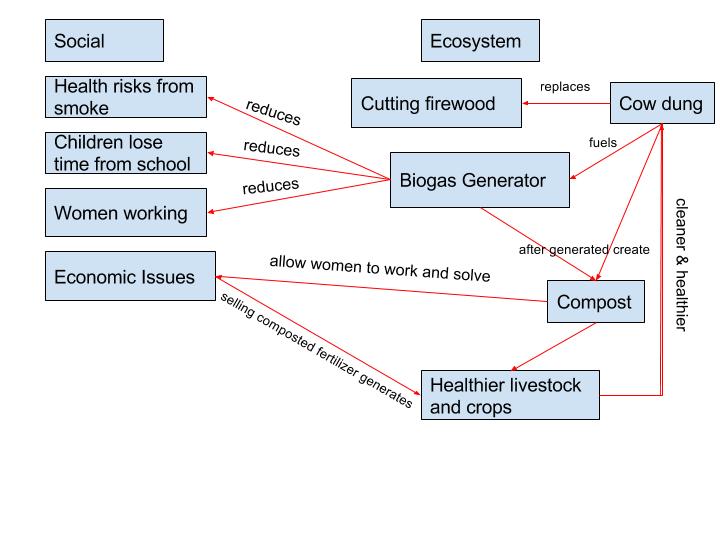
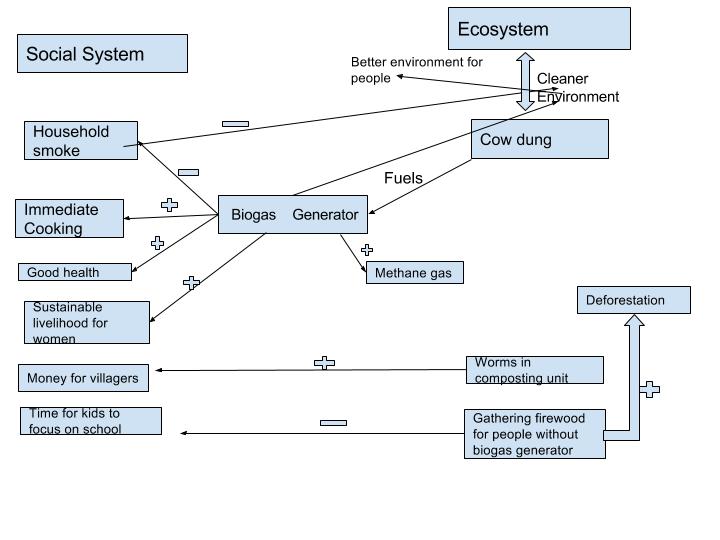
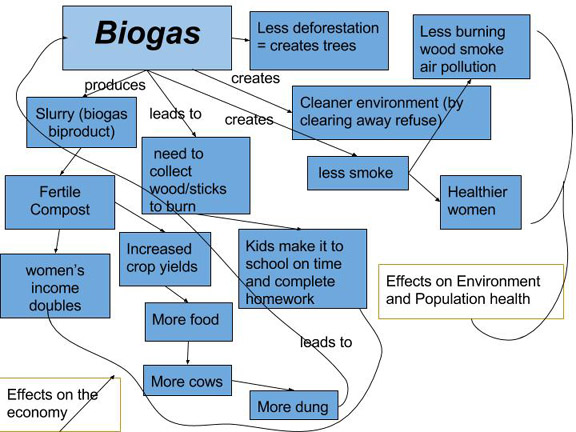
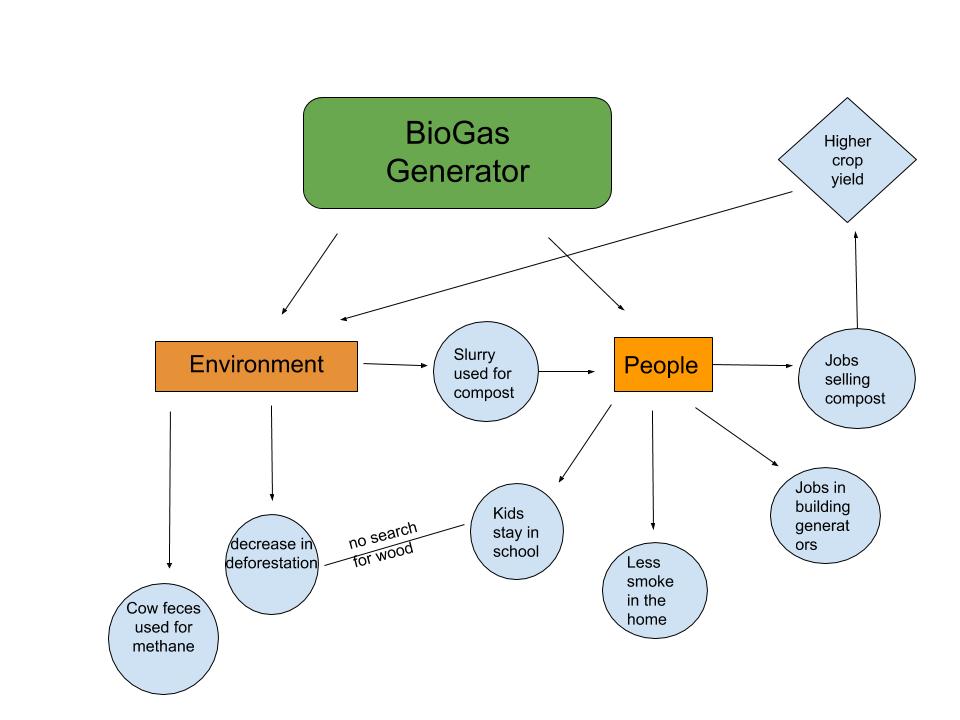
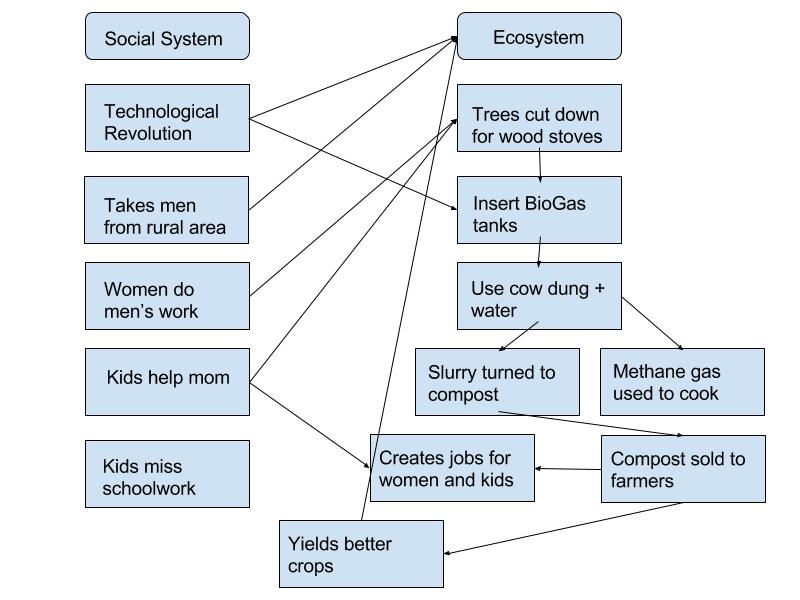
My systems diagram shows how the innovative biogas generator produces a coupled human- environment interaction. Cow dung taken from the environment and used as fuel for the generator overall produces a better human, social system. When humans use the generator to cook they are not using a wood fire smoke technique that would produce harmful pollution into the environment. Therefore, again, the cow dung from the environment is a way that the environment is impacting humans, and then humans are making a positive impact back on the environment.

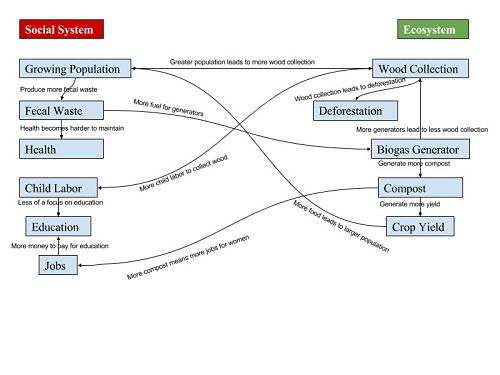
One symbol I used throughout my diagram was plus and minus signs. The minus sign represents the word less or shows a reduction. For example less household smoke produces a cleaner environment. The plus sign represents more so another example: people that will gather firewood for their wood fire, that don’t have a biogas generator, will cause more deforestation. I tried to represent every aspect of the environment or social system that the video described. The ultimate goal of a picture like this would be to show people that a biogas generator has a positive feedback loop. Once other people see how positively the generator is impacting the environment it will lead to more people using the generator, as D Vidya Sagar plans on building an additional 50,000 generators.

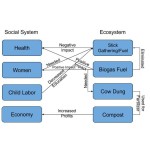
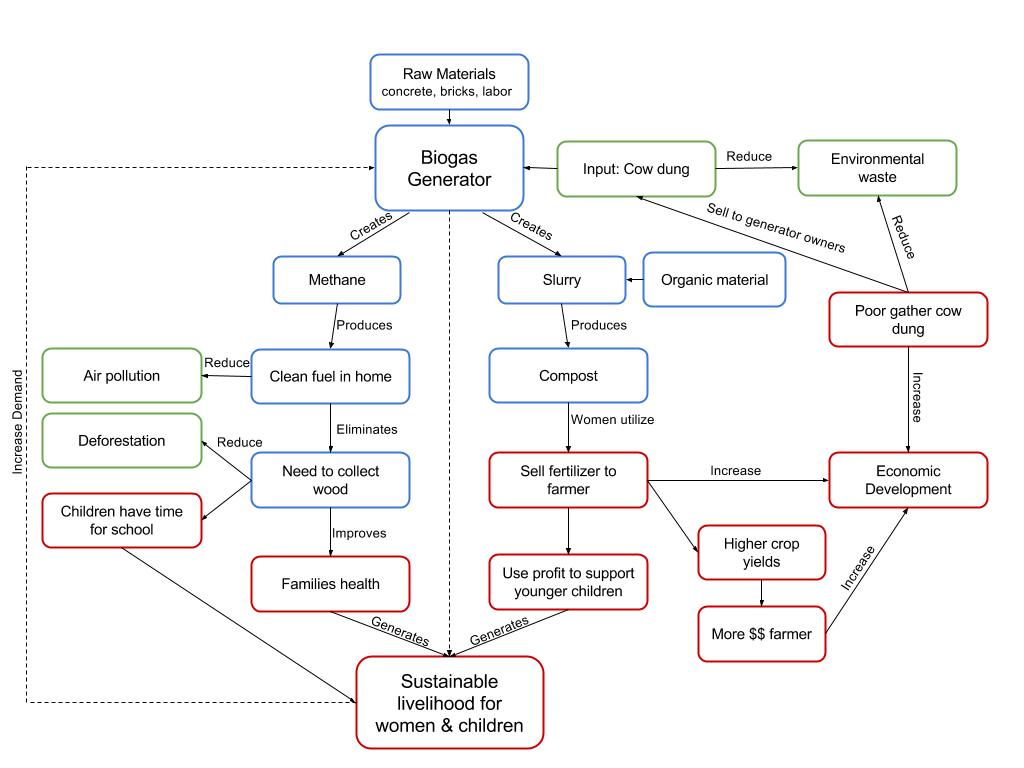
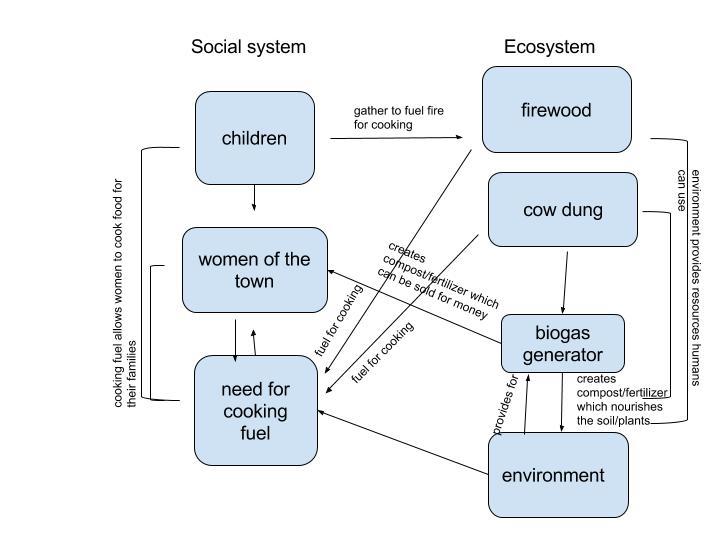
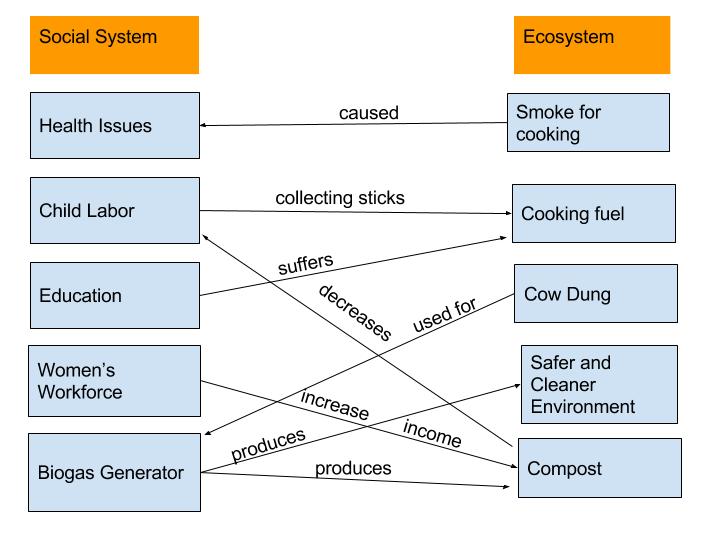
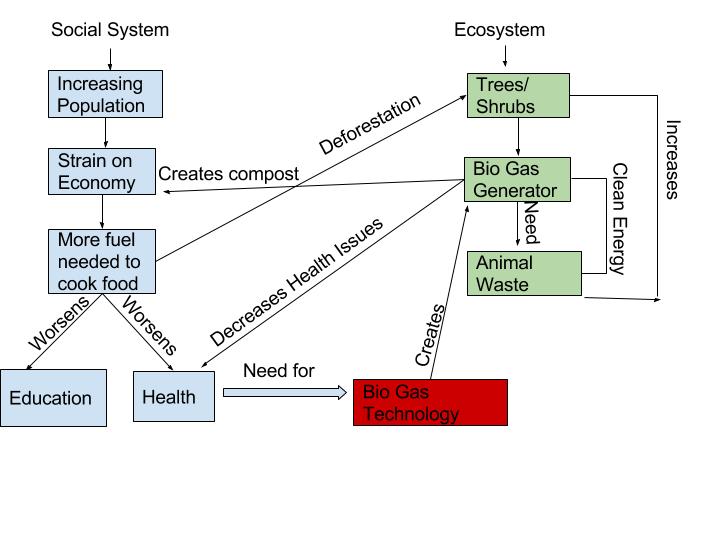
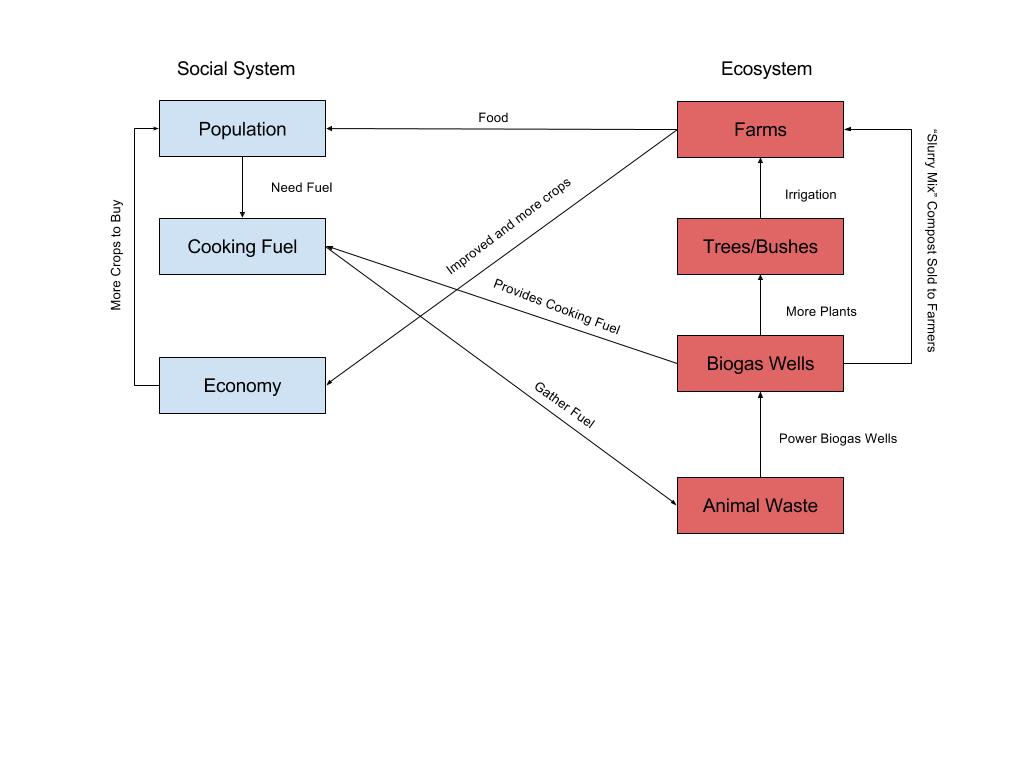
My diagram reflects the one in “What is Human Ecology,” in the way that myself and Marten have both made separate columns to classify components of the social system and the ecosystem. Both diagrams show how each system relies on the other system. I tried to make my diagram less cluttered by using the plus/minus symbols whereas Marten described what his arrows represented in more depth. He also described how the generator would benefit poor vs. wealthy people, whereas I focused on how it could benefit people in general. With two different comparisons of the generator there is more opportunity for other benefits of the generator to arise that one author might not have realized.

biogas_diagram_vis5188

Module 2: Biogas Diagram– Katie Kurtz

Biogas System Diagram

In the clip we watched their main focus was on what was having a negative effect on their society and ecosystem and how they were able to solve this. So I reflected their main focus of what caused a positive effect and what caused a negative effect on their society. The main social ideas they mentioned in the clip were Health, child labor, education, and jobs and revenue. There was also some focus points mentioned in the clip that had to deal with the ecosystem and they were the biogas systems, composting, the use of cow dung, crop production, and firewood. These main ideas all were interconnected with each other and had either effects that increased or decreased the other. The diagram from the reading was both very similar and also very different from my own. This diagram, like mine, had interconnections between the main two categories. However, it was also very different from mine, because there was not  crossover effects between the two main categories. For example in my diagram, firewood from the ecosystem side had an effect on health from the social side of the diagram. These similarities and differences exits, because the graphs both contain social interactions and interactions within an ecosystem, and regardless of the the specific focus of the diagram there is always going to cross interactions between the two, because humans are constantly interacting with the Earth and the Earth is constantly interacting with humans. These Diagrams provide a visual of the interactions between humans and the environment, from this visual we can learn about the continuous effects these two systems have on one another and how they create a system together.

Biogas in India – Sara Getson

This is a great example of a human-environmental system where the population effects the environment (at the level of deforestation and smoke emissions) and the environment also effects how the people live in India. Through the use of biogas there are some instances of positive feedback loops, especially where the production of biogas is shown to increase crop yields. By increasing crop yields, there is thus more food for the human population as well as for the animals, which in turn causes more dung to be produced and allows the cycle to continue with the use of even more biofuel. The trees are somewhat resilient, although overharvesting will lead to a point of no return. This shows how the use of biogas instead of burning trees for fuel, keeps the trees at a stable number. This method also shows how improved technology can lead to a better human-environment relationship overall. Upon reviewing Marten’s systems diagram, and then comparing it with my own, I note that they both include an environmental sphere as well as a human impact sphere (How it relates to human society and the economy). There are also positive feedback loops shown in both of the diagrams. They differ however in their detailed organization in that my diagram shows the flow of impacts within each individual sphere while Marten’s shows how each sphere impacts the other. Similarities and differences arise mainly due to what is being studied, I would say. Marten’s systems diagram is looking at a much bigger picture, whereas mine is looking at a particular issue. Seeing these differences can aid us in understanding the details of an issue as well as how they might impact issues on a larger scale.Biogas_seg5335

Module 2: Molly McLaughlin

I first started out with the problem of wood burning stoves and what comes along with them such as ruining forests and putting children to work when they should be worrying about their education. The solution is in the center which is the creation of the biogas systems. The first good thing that they produce is methane gas which then flows to the house for cleaner and safer cooking. This cooking results in less smoke and better health conditions for the people using it. The second good thing produced by the biogas is slurry. This slurry is turned into organic compost which the women then sell this fertilizer to farmers for money. As a result of selling the compost, the women’s income doubles meaning a better quality of life for them and their family. This part would be considered a positive feedback loop because as women produce more fertilizer there is more to be sold and they can make more money for themselves and their family. My diagram is similar to Gerry Marten’s because we have the ecosystem and social system separated on both sides to show which concepts go where. However, I have arrows going between the concepts in each system while he has general arrows above and below his diagram illustrating the general connections. I think that mine shows the direct connections because it demonstrates how both systems are affecting each other instead of two simple lines saying how the environment affects humans and vice versa.

Geog 030 Module 2


Gunderson MOD 2

The diagram below shows that the social system provided the means for someone to innovate and create the biogas generator. Biogas generators provide reduced smoke which facilitates cleaner cooking and less pollution as well as creating fertilizer through using dung. Because there is less wood required, children can spend more time in school and on their studies which will result in higher education, more/different employment opportunities, and (hopefully) future innovations. All of this came about because of fewer health problems which also facilitated higher crop yields and better usage of land. The diagram shows a system that isn’t very resilient, in my opinion. For example; if there was a disease that affected cow/farm animal population drastically, then there would be little or no dung to use for biogas, forcing people to revert back to using wood for their primary source of fuel which would either cause a breakdown of the rest of the system or severely hamper its efficiency. In regards to population this represents both, a positive as well as a negative feedback loop. It reduces the need for the large families to gather wood and work, but at the same time it will provide economic opportunities for people, that will be able to support larger families. Compared to Gerry Marten’s diagram: There are similarities in that they both show causes, effects, and solutions. My diagram shows an overall flow between the ecosystem and social system not just cause and effect. They’re similar because it’s based on the same situation.

Untitled document


Lesson #2 Coupled Human Environment Systems – Lucas Skiba

In my diagram I created for Biogas Generators I wanted to use it or portray it in a systems perspective. Meaning the social system and the ecosystem are two different systems but they are working together to hopefully get a positive result. The arrows pointing from one system to another are to show how they each effect each other while all being in the same system. For example on one the first arrows goes from soil to income. Now when biogas generators have created this methane gas for cooking there is an compost left over for the cow dung or plant residue use. This compost can be converted into soil. Woman sell this soil to farmers for money to create an income. Another example is the arrow from population to forests. Now families without biogas generators use wood or brush to fuel or cook there food. Usually its the children’s job to get this for the family. Families believe the more children the more fuel for cooking. But since the population has grew over time so much deforestation has occurred which becomes a huge problem. So hence the biogas generator. This means no more wood or brush to burn and less children which is less population. Which means the forests will grow back and not decrease. It is just important to realize that even the smallest part of a system can have a huge impact on anything else in the system.

To the diagram we read about in Gerry Martens reading “What Is Human Ecology?” i think our diagrams are very similar. You have two different important systems working together to create an over all function. Each system is showing positive feedback for each individual arrow thus bettering the environment. Our diagrams are a bit different because I was focusing more on how each system is helping one another with biogas generators. Marten’s diagram is showing how population and deforestation and more of the negative aspects are affecting each system. There are similarities and differences because we each view each system differently. Even know most of the information in the diagrams are the same they are slightly different because everyone portrays each system in there own mind. This is a good way to introduce ecology because you are seeing the relationship between people and the environment.

Biogas Diagram

Biogas Diagram

Biogas System Diagram-Adriana Buonocore

My diagram illustrates how the BioGas generator affects the environment and the people within it. The generator uses cow feces for methane which decreases the demand for wood which means people do not need to search for wood, decreasing the rate of deforestation. Since kids do not have to help look for wood, they do not miss school. The use of methane in replacement of wood creates less smoke in the home leading to less illness. Jobs are created in order to build the generator as well. The slurry created by the generator is mixed with fibrous materials and processed by worms which creates quality compost. This is good for the environment and creates more jobs for the people who sell the compost to farmers. Farmers have reported an increase in yield which relates back to the environment. This illustrates a human-environment system where the people’s actions affect the environment and the environment gives back to the people. The BioGas Generator could also be considered a positive feedback loop because the existence of one generator has lead to more money and jobs in order to create more generators. In Marten’s diagram he shows the relationship between two systems which are the social system and ecosystem and he includes the process of using wood for fuel. I focus on the benefits the generator gives to the environment and the people. We both show how the environment and people are connected to the generator. His diagram shows the process while my diagram adds the benefits of the process.Module 2 Diagram-2

Katie Cuerou Biogas

biogas_cec5524

My diagram begins with the main topic of this video, biogas. As the video explains, this innovation creates a system which benefits the environment and the social well-being of the rural community. The purple ideas of this diagram represent the social system, whereas the green ideas represent the environmental system. Biogas eliminates the necessity of collecting sticks for fire, which therefore lowers smoke production. The decrease in stick collecting saves the environment from deforestation, where the decrease in smoke saves the community from health defects. Lack of stick collection also allows the children more time for schooling. Biogas is produced from cow dung, which creates the methane gas. The methane gas is then transported into the household for cooking purposes. The creation of slurry compost creates jobs for the local women, which contributes to the economy. With a better economy, there is more money to pay for education for children. The system diagram shows that everything, more or less, comes full circle. Elimination of stick collection leads to more education, which leads to a better economy and more jobs, which leads to the composting, which leads to the biogas, and so on. The video proved that this is a stable system with little to no complications. I think this rural community proved that sustainability is possible when resources are low, and they can come from something as natural as cow waste.

I did not base my diagram off of Marten’s Human Ecology diagram, so the similarities and differences are present. Where Marten started with the Social and Environmental systems, I started with the main factor that leads to the benefit of both systems. We both connected certain environment and social links together, just in different formats. Also, rather than using “increase, decrease, create, improve,” Marten uses examples like “food, cooking fuel, and cut wood.”

Module 2

biogasdiagramLD

The core ideas behind my diagram as portrayed in the five minute video explain the effects of the introduction of biogas fuel into a society such as the one shown, a village in India. Seeing the visual of the diagram highlights the amount of benefits that biogas fuel actually does have. It greatly impacts both the social system and ecosystem of India, and it becomes apparent that many of these impacts relate and overlap with each other, as shown through the many arrows to each effect. A core idea portrayed here is the human- environment system. For example, biogas affects the ecosystem because it creates quality fertilizer, which in effect benefits the social system in that farmers gain higher incomes due to their higher implemented prices. The benefits of this fuel is unmatched due to both its stability and resilience.

In regards to Gerry Marten’s diagram, Figure 1.5, there are a few similarities and differences from my personal diagram. Both diagrams break the benefits up into two categories, Social System and Ecosystem, and show the relationships between them using arrows. Marten’s diagram uses more descriptions for his arrows, and makes numerous connections using the same concepts, which is interesting to see how many impacts one concept, like cooking fuel, can make. There are similarities and differences between the two diagrams because the relationships shown in the video can be interpreted in several ways.

Module 2: BioGas Diagram

The core Ideas of my diagram are to show how BioGas generators are coupled Human-Environment systems. This is for two reasons, the first being that the generators are made and operated by man power; however, use natural waste from cows, people, etc. to create the methane gas product. The second is that it creates a positive feedback loop between the two as the cow poops which composts to makes methane gas for peoples use as well as fertilizer to increase crop production feeding the cows and thus making more dung. This is a system where the environment as well as humans rely on each other to better the ecosystem. My diagram is a different method then Marten because while his is an impact diagram showing directly how once thing leads to another and so on, mine is a component diagram showing how some effects are just pieces of another theme. The two diagrams are similar only in that mine follows a path of components that lead directly to the other part of the diagram showing a direct impact that the environment has on educational aspects of Indian kids. From this compare and contrast we can learn that while each method is different they both convey information about a certain topic, yet by incorporating some aspects of each types in to one it can help create a more powerful diagram.

Untitled document


Module 2- Biogas in India- Kristin Crockett

The diagram below displays the interdependencies of the ecosystem and the social system and how the usage of biogas technology has a positive impact on both. My diagram focuses more on the specific details related to the Biogas technology, where Gerry Marten’s diagram focuses more high-level aspects. There are a few similarities, between Gerry’s and mine. First is how the social and economic systems are ultimately interconnected. A change in one can impact the other. In addition, within each system the factors area also connected. Take Gerry’s diagrams for Social systems, he has lines from each impacted area. For example knowledge is connected to each concept, and with mine, I have double arrows from each area pointing back to the system, which is displaying that everything impacts the ecosystem and the ecosystem impacts everything. In addition, I have a two-way arrow in the middle, which demonstrates the connection between the social and the ecosystem, where Gerry’s diagram points out similar connection of how human activates impact the ecosystem, and the ecosystem services ultimately impacts the social system. Comparing them both together we can learn the relationship between the two systems and how they depend on each other. A change or impact whether it be positive or negative ultimately can impact the other.

biogas_klc5793

Module 2-Human Environment Systems

In my diagram I chose to focus on the relationship between the ecosystem and social system within the Indian society, more specifically in relation to the village shown in the film. The diagram I created displays the concept of a negative feedback loop. An example of a negative feedback loop within my diagram is the relationship between the smoke and its effect on creating biogas. Because firewood produces so much smoke, that smoke creates health problems. These problems are the main factor as to why biogas and the biogas tank was created. This negative feedback from the smoke persuaded D Vidya Sagra (the founder) to find a solution. Another factor to take into account with the ideas in my diagram is that it displays the concept of IPAT. The IPAT equation is used to show the relationship between the poor environment of this small village in India with its effect on the humans (more specifically the women and their children) living within that village. The rural animals, such as cows are able to contribute to a product called Cow Dung. This Cow Dung is the core resource used to power the biogas tank. The biogas tank is then able to produce compost and methane gas; which then allows the families to not only make a profit of selling this compost but as well as the ability to prepare meals in a safe environment (IPAT).

In conclusion the diagram I created is very similar to that in the Marten reading “What is Human Ecology.” In both diagrams they show the negative and positive feedback loops within the social system and the ecosystem. They provide connections between the the two different topics. The main way in which our diagrams are different however is the fact that he focused on more of how the environment aspect such as plants, water, soil etc effect the social system. In my diagram I focused on more specifically how animals such as cows contribute to a cleaner, healthier environment for those of the Indian village. What I learned by these comparisons is that diagrams can be different whether it be the content or context that it is referring to. However, in the end there are connections and links that can be found within all aspects of a diagram, whether that be positive or negative. I also learned that the social system and ecosystem though different, depend on each other a great deal. When one is effected, so is the other.biogas_diagram_alj5291

Module 2 – BioGas in India – Tyler Brackbill

The main ideas behind my diagram show that a technological revolution in India, like the one in the video, can expand into technological advancements throughout a region and even into the poorest slums in the countryside.  Relating this back to the lesson, i believe this shows an increased stability in the ecosystem that is India.  Using a more renewable resource of cow dung turned into gas compared to cutting down trees for fire is better for the environment and health.  Also technology obviously played a big part in this transformation.  Using new gas ranges to cook leads to less deforestation.  And finally this is a positive feedback loop.  More things came as a result of the human intervention.

My diagram is similar to the one in the article because they both show the human interaction that goes into improving the ecosystem.  In turn, the improved ecosystem can help benefit the humans.  They differ because mine does not have as much detail but is more specific to the scenario.  The environment in that part of India shows that the model is universal to any ecosystem that has human interaction.  The ecosystem has its own cycle and so does the social system.  They both work together to become stronger.biogas_diagram_tbb5100

Human-Environment System Web

        The core Idea behind this web is the human-environment system that is set up here in India. It all starts with the Industrialization of the city, which man interacts with the environment to create fuel and technology. This prosperity brings in the younger population looking for jobs and success, leaving the outside areas poorer and emptier. Due to the lack of money, most people use wood fires to cook, which has many negative effects. Vidya Sagar wanted to make an impact on this human system by providing the poorer areas with fuel for proper stoves. While being environmentally friendly, he was able to make factories that used one of the area’s abundant sources, which was cow dung. By doing this he successfully created a co-dependent system that was economically sustainable and environmentally friendly.

        Both this web and Marten’s web focus on the same ideas that involve fuel and food. The difference in this web aside from physical features is the specifics
Untitled document
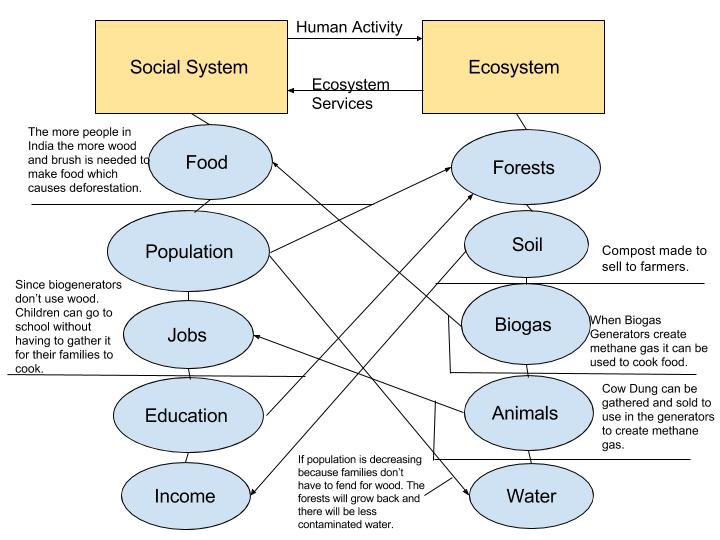
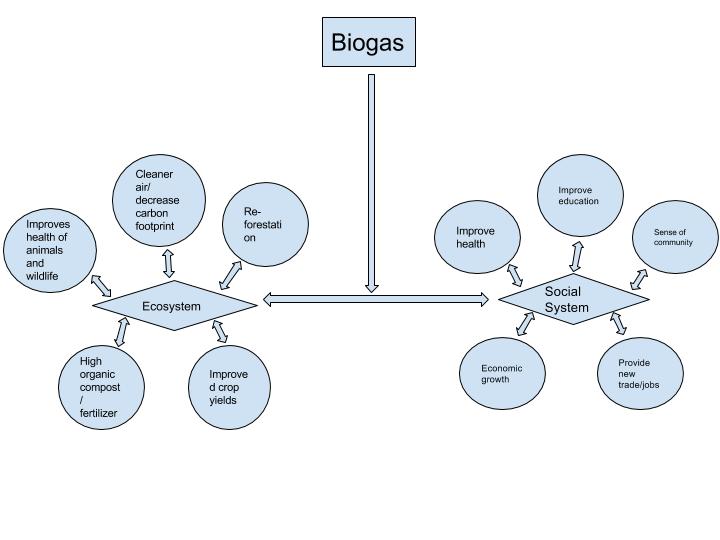
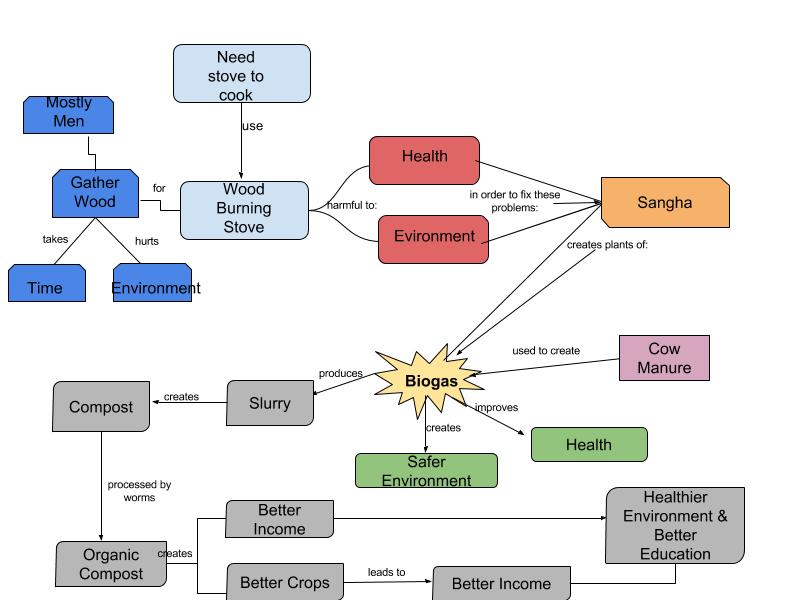
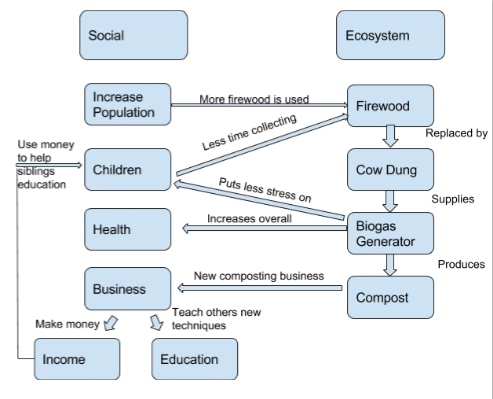
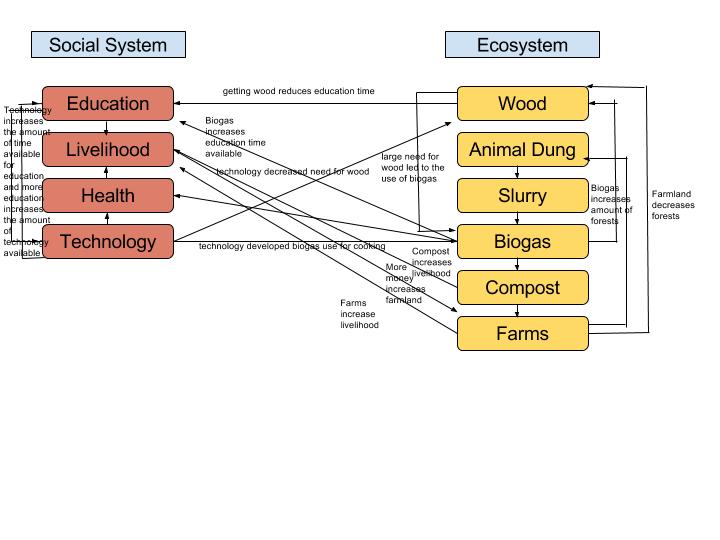
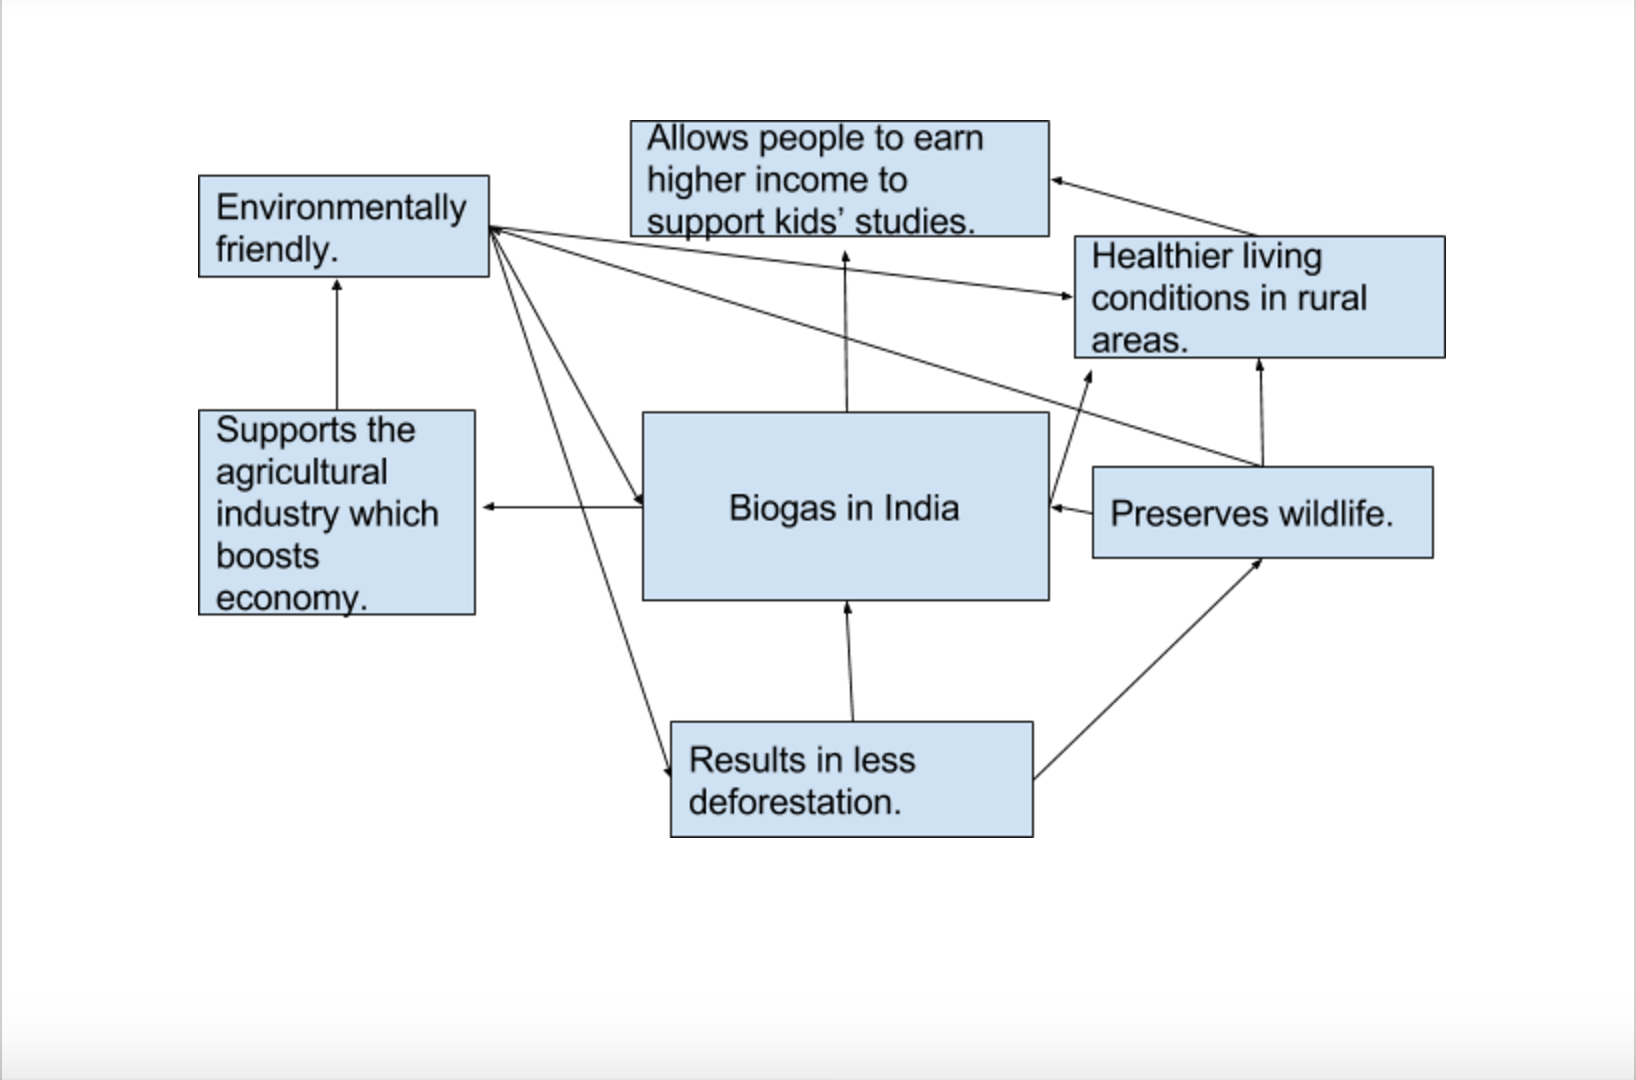
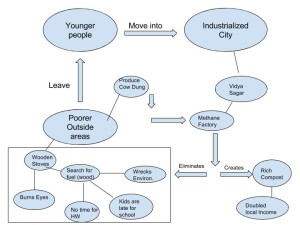
of the culture. Marten’s is a more broad diagram while this pertains to only one instance. What can be learned here is that environments and systems are inherently different around the world. There is not general chart for all of them, but many operate in similar ways.

Module 2 – Biogas System Diagram

biogas-kwl5211

My diagram is split up into two main systems, the Social System and the Ecosystem. The Social System is composed of Growing Population, Fecal Waste, Health, Child Labor, Education, and Jobs. The Ecosystem is composed of Wood Collection, Deforestation, Biogas Generator, Compost, and Crop Yield. While each of these components falls under the Social System or Ecosystem, they are all interconnected by the effects of having a Biogas Generator in the Ecosystem. The main flow of my graph is that with a greater population comes greater wood collection and deforestation. Children are the primary collectors of this fuel source so child labor increases and and education falls. With a Biogas Generator, there is less wood collection and therefore an increase in education. It always creates more compost and therefore better crop yields. In the end, it leads to a positive feedback system by producing greater but healthier population and starts to go back into the same cycle.

Compared to Figure 1.5 in What is Human Ecology, my diagram has some similarities as well as some differences. The most obvious difference that one would notice right away is that Figure 1.5 much more of a cycle between Social System and Ecosystem while mine bounces back and forth between the two a lot. I think this could be the cause of more of a design choice on my end and I could probably focus a little more on making it cyclistic, but I thought the way I designed it was good as well. The similarities is that the differences between my systems are well defined. There is no component that could go in either one system or the other, just like Figure 1.5. These similarities and differences exist because of what I chose to focus on as my components. A system can be as small or as big as the designer wants and that will greatly affect how cyclistic the figure is, as well as how interconnected all the components are. The way that I chose to design mine could have focused on different components to make it more similar to Figure 1.5. I think what you can really take away from this is that there are a lot of different components to focus on when making a figure like this. It can really change the look and the impact it has on a reader; it is definitely something that the designer should be aware of when creating one.

Module 2_Joseph Carlamere

The biogas video shows the coupling of the human-environmental system and the interactions between humans and the environment. To display the interaction in my system diagram, I listed the components of the social system and the eco-system that have a direct interface with one another than dug a little deeper to identify the non-direct collaboration. To start, by installing a biogas system removes cow dung from the community. This will improve the overall health of the people living in the town; plus removing the dung creates compost, which leads to improved soil conditions resulting in increase agriculture. Another aspect of utilizing the biogas system is better indoor air quality inside the house. This is achieved by removing wood burning stoves and installing gas-burning stoves. A byproduct of this improvement is increased health. The biogas system has increased the local economy too; the women of the town are able to bag soil that is produced by composting. Additionally, local bricklayers are able to earn a living by building the top of the biogas container. Lastly, the children of the town are able to get a better education. The mornings usually consisted of gathering branches and wood; now they are able to attend school. One more interaction between the social system and ecosystem is reforestation and increase wildlife survival rate, which is achieved by not removing excess forestry to burn for cooking.

Reference:
“Coupled Human-Environment Systems.” Geographic Perspectives on Sustainability and Human-Environment Systems. Pennsylvania State University, 2016. Web. 26 Jan. 2016. <https://www.e-education.psu.edu/geog030/node/324>.

BIOGAS-JZC5984

Module 2 Human-Environment Systems

MODULE 2

One thing that my diagram definitely explains (that was also talked about in the modules) is the human-environment interaction that can occur in many different ways.  It was discussed in the video how humans used a wood burning stove to cook which affected the environment by polluting it with smoke.  Humans also used work from the environment which negatively affected it (this can be seen by the blue boxes).  Sangha came up with the idea of biogas that humans can use that will lead to a safer environment, and a more healthy option.  The boxes in the bottom left of my diagram depict this.  Another concept my diagram is focused on is stability.  When the wood burning stove was used, there were a lot of negative disturbances such as it being time consuming, harmful to the health, and to the environment.  Through the production of biogas, the disturbances decreased as more positive impacts were seen, and the system became more stable.  Looking at figure 1.5, this system also seems to be stable which is one of the similarities between the two diagrams.  Another similarity is that both diagrams discuss the positive effects biogas has on health/environment and the negative impacts the wood burning stoves had.  Besides the similarities, there are also differences such as Figure 1.5 was divided into social systems and ecosystems and it used solid and dashed arrows to depict how they affected each other.  My diagram is more of a continuous web where actions lead to consequences.  There are similarities and differences between these two diagrams because it depends on a persons outlook and creativity.  Each author can think of the connections in their own way and translate them onto paper differently.  It is interesting that with all of the same facts everyone can come up with their own idea to explain a relevant topic!

Module 2: Biogas in India

Biogas_yjr5005

The core idea behind my diagram is to show the connections between each element in the social and ecosystem. I want to combine the two systems into one complete feedback. In the video, social system and ecosystem are closely connected. That’s why traditional cooking method (using field wood), can affect women’s and children’s daily life intensely. After new technology, Biogas plant, comes up, the waste of cooking is different, and people’s life changes as well. This case best explains how the Human-Environment system operates. In the diagram, women &children, tank, and cooking are the three components in the social system. Wood, smoke, biogas plants, organic compound, and compost are the key elements in the ecosystem. Other things like school & entertainment are the relative elements for the case.

Compared my work with the example diagram, the components in social system and ecosystem are different. The example diagram illustrates 8 components in the social and ecosystem. It combines small elements mentioned in the video into one group. For example, biogas generator includes all its outputs, like methane gas, organic compound, and compost. It shows these outputs in the interactions (above the arrow lines). For me, I just separately count them as three different components in the ecosystem. However, the way I draw the diagram and the ideas about how the social and ecosystem interacts with each other are the same. The two diagrams are different due to the different opinions for the video, and abilities to summarize the elements. From these differences, I know how other people think of the social and ecosystem interactions. Besides that, I learn that I need to summarize and separate components in a complete system and feedback loop.

Module 2: Biogas in India

biogas_diagram_tjd5465

My diagram of India’s biogas generator’s effects show how everything is connected. It shows how one invention can solve so many problems for their people. By having the biogas generator, cooking can be done with no smoke which would improve the quality of the air protecting their health and environment. The children would have more time for their studies as they wouldn’t have to hunt for wood and therefore improving their education. Incomes would increase not only for the manufacturers and sellers of the biogas generators but also for the farmers who would be selling the cow dung and for the women who sell the dirt residue. Both the wood burning and biogas concepts for cooking effect the landscape. In comparing my diagram to that of Figure 1.5 in the Marten reading “What is Human Ecology?”, I find that they are the same in the way they are set up. We both touch on some of the same factors but the Figure 1.5 diagram seems to stay focused on the breakdown of materials needed for fuel for the biogas generator and on the people cooking food. My diagram focuses more on the benefits and effects of the biogas generator on the environment and the people. I feel that the similarities are because we were presented with the same information and there are differences due to our personal interpretation. Figure 1.5 shows us more of the deforestation and mine shows more of the impact on personal lives.

Module 2: Biogas in India

biogas_diagram_cqr5246.jpg

Biogas in India is just a small step that was taken to help out the ecosystem. The social system and the ecosystem influence each other and as I read in the reading, the equation: I = P x A x T (ecosystem = population x affluence x technology). It relates to the system diagram we read and then created because it shows that everything impacts the ecosystem. From the population growth, so many things can happen throughout the environment (using firewood to cook) that cause a negative reaction, but can change to positive by changing what is happening in the environment, which then causes change in the social system.

Comparing my diagram to Gerry Marten’s 1.5 Diagram in “What is Human Ecology”, I notice a lot of similarities. We have the same ideas, however his seems to be more specific. Also, my diagram seems like more of a cause and effect mostly, but in his diagram, it seems that everything ties in with each other. I think what I’ve learned from these comparisons is that everyone has their own perception of how everything is connected and how the social system and ecosystem effect each other. I also think that everyone has an understanding that it is a cause and effect situation because something that happens in the social system will cause something to happen in the ecosystem and vice versa.

Module 2: Biogas in India

My system diagram presented shows the effect how the new and old ways for cooking has on the social system and the surrounding ecosystem. The arrows show the impact on that particular topic. The diagram shows the positive and negative aspects for using each fuel source. The negative impacts shown are related to using sticks for a fuel source by decreasing health and using child labor. The biogas fuel shows the positive impacts on the social system and ecosystem. The biogas fuel eliminated the need for child labor and has less health concerns. Also, the biogas fuel has helped their economy by selling compost that was made from the waste of the biogas food to the local farmers for fertilizer. This diagram also shows the biogas fuel has more resilience over the old fuel by, not having to depend on sticks and child labor.

When comparing my diagram to Figure 1.5 in the “What is Human Ecology?” article, there are similarities and differences. Both diagrams highlight the components of the social system and ecosystem. Also, both have the same general idea of the human-environment system and how they impact each other. Both show the different components of the biogas fuel and uses of its byproducts. The differences of the two diagrams is that in the Marten’s diagram, it uses the overall population, where in mine, I broke it down into the women and the child labor aspects. Comparing the two diagrams showed how there can be different perspectives and interpretations. Both diagrams highlight the main concepts that were discussed during the video.

Module 2: Biogas in India

The system diagram I created illustrates the chain of effects the biogas generator has on India. As described in the video, people in India have been experiencing problems by using the traditional wood burning stove. It would create a smoke that affects on health to women or people around, wrecks the environment, and prevents children to focus more on their education. However, the creation of biogas can resolve all the problems. Biogas generators allow better and improved living conditions which leads to better health, prevents deforestation, allows children to focus more on their education and even creates new job opportunity to women. The core idea behind my diagram is that the social and ecosystem are helping each other to create a better living for both the human and environment. To add on, that the creation of biogas generator has improved in a positive way. Moreover, when comparing my diagram to Gerry Marten’s, there are several similarities and difference we used. Both Marten and I separated the social system and ecosystem to allow more clearances. However, Marten’s diagram has focused more diversely than mine and created a better, constructed diagram. For example, he has more sub-categories in both the social system and ecosystem and clearly labeled there effects. On the other hand, my diagram simply connects each effects together. By comparing the two diagrams, I think I learned to focus more broadly in one subject and try to minimize the connection further apart.

Biogas_ehl5050

Module 2:Biogas in India

biogas_sjg5523

Biogas in India is one of the simplest real-life examples of how a social system can impact an ecosystem and vice versa. The ecosystem starts as just natural resources, such as livestock and trees, as shown on the diagram. These natural resources are eventually turned into fuel, because of the societies necessities of cleanliness, food, and some sort of income. As the demand for these grow with a growing population, the people begin to produce their own crops, adding to the natural resources of the ecosystem. This cycle will continue to grow until eventually; the soil dries up and can’t be used anymore. This is one of the easiest ways to understand the “IPAT” equation, because as the population rises, the impact on the ecosystem (the soil being used up) becomes greater until it reaches its carrying capacity, in which the population will have to either make a significant change, or begin to drop.


This chart differs from figure 1.5 mostly because of where they both go into detail. The chart that I have made goes a lot more into what they are using the resources on specifically, (cooking, cleaning, money, etc.) instead of why they need these things. Figure 1.5 has more detail into why these things are in such demand (the population rising, resulting in the need for more food.) I feel in terms of the big picture, these diagrams are both very similar, with different details in different areas.

Lexie Gersbacher, MOD 2

GEOG Mod 2-2

My diagram begins with a growing population in India which then leads to the deforestation in India. My diagram then goes to show that firewood resulted in Children working, which was then replaced by cow dung and supplied the Biogas Generator. The Biogas generator not only decreases the number of children working but it also increases the health of the people. The remains of the generator is mixed with worms and different materials that result in compost, which then creates improved fertilizer. The fertilizer provides women with job opportunities which then results in increased business.

My diagram is similar in structure to Gerry Marten’s figure 1.5 in his reading “What is Human Ecology”. We also both focus on how the generator is fueled and what the outcomes are. This diagram made the connection between human-environment interaction more clear to me. You get a good look into systems perspective, where in this case, the human system and the environmental system intertwine. By using this generator, the interaction between humans and their environment is producing a positive feedback loop and you can tell this because there’s a repetitive action continuously reoccurring (women working with improved fertilizer) furthering business.


BP biogas

The idea behind my diagram is to show, in detail, the effects of utilizing methane gas producing generators vs. traditional wood. Trying to imagine ever possible positive and negative effect is quite daunting but important. As we live in a coupled human environment our actions, in the human system, have an effect on the environment. In turn the environment effects the human system. As discussed in the lecture, this circular motion is continuous and very intricate. Every action has an effect, whether positive or negative. In the two paths displayed in my diagram one has negative outcomes. Over harvesting of a natural resource will deplete that resource. Not only will the resource be depleted but less ground cover brings increased erosion, which leads to less usable land for farming which leads to less produce and grain crops for humans and animals. Not only that but the depletion of trees results in less habitat for birds and other insect eating animals, which would lead to increased numbers of disease spreading insects and push disease spreading rodents closer to human population.
Comparing the two diagrams you see that both display a unit representing the social system and the ecosystem. You can also see in both diagrams there are representations of technology, water, soil, animals. The biggest difference is the Marten diagram is very broad in its makeup, while my diagram is well defined for a specific task. With both diagrams we see both the social and eco system effect one another. biogas_btp0125

Module 2: Katy Bordt

biogas_diagram_Klb475

In the system diagram above, the green represents the ecosystem and the pink represented the social system. My system diagram show how the landscape was affected by the wood burning stoves and biogas. In module 2, we learned about how landscape is more than just the scenery. The module defines landscape as a “combination of environmental and human phenomena that coexist together in a particular place on Earth’s surface.” The wood burning stove affects the landscape in many ways, such as the need to cut down the trees for fuel. Also, my system diagram focuses on how the life of the village people will be improved because the biogas. The system diagram above and Figure 1.5 are similar because they are modeling the same system. In both diagrams it is shown how useful the biogas are in the villages, for example the compose produces better crops.  The diagrams both focus on the same main points, such as the demand for cooking, the different fuels that can be used, and how the fuels affect the landscape. The main difference between the diagrams is that my system diagram above is more focused on the social system and the effects the biogas have on the village. After studying both diagrams, I believe we can learn how different topics indirectly affect each other. For example, without the use of the diagram I would be hard to see how the biogas affects the economy or education.


Module 2: Learning Activity- Kelsey Somers

biogas_diagram_sdb244.jpg

The core idea of my diagram is to show how the biogas plants interacted with both systems. I used system perspective to show there were both positive and negative effects in each system. The main issue presented in my diagram was how the wood burning stove presented a lot of negative effects. The wood burning stove needed firewood which caused the children to have lack of education, to do homework and to have meals. The use of firewood caused smoke which led to many negative effects. First the smoke was harmful for the environment, but also the smoke was causing health issues. The production of the biogas plants solved the negative issues leading to a positive feedback loop. The biogas generator benefited the environment by using cow manure. My diagram also shows how the composts from the cow dung benefited both women and farmers. Women sold leftover composts to farmers which then led to double income and farmers increasing their deals. The outcome of biogas generators benefited both the community and the ecosystem. My diagram has both similarities and differences to figure 1.5 in the Marten reading. Marten and I diagrams are both set up similar to one another. However, our concepts were different. My diagram focuses more on smaller effects. There are similarities and differences because there are many different ways to look at a diagram. What can be learned by comparing the two diagrams is that there are many different ways you can compare the concepts in both systems.

Impact of Biogas Generators on Livelihoods of Individuals in India

The system diagram below represents the chain of effects that biogas generators have on the rural ecosystems in Bangladesh, India. The current problem people of this region face without a clean fuel alternative to wood burning is degradation of the land and health issues in young children and women. Biogas generators allow more time for children to go to school, improve living conditions and health, and create a compost product, which women utilize to generate income. The core ideas behind my diagram are the social, environmental, and economic factors that cooperate to transform biogas generator technology into sustainable livelihoods for women and children. I view an ecosystem as an interaction between the physical environment and human social system. Coupled human-environment systems show the impact of the relationships between the human social system and ecosystem.

Notice that the diagram is divided by color: blue (direct factors of biogas production) green (environmental effects), and red (social and economic benefits).Together the generator and women entrepreneurs reduce environmental waste, improve the lives of their children, and create a product that aids the farmers of rural areas.

Figure 1. Local impact of biogas generator in rural Bangladeshi, India.

Module 2- biogas diagram lmr5479Compared to Marten’s diagram, this diagram has few similarities, but both pay attention to the environmental impact and demand for biogas generators. Marten’s diagram focuses on the larger social system while this diagram is specific to the livelihood of the individuals affected. There are similarities and difference between our diagram because we are concentrating on different scales. My diagram is a local scale while Marten’s focuses on a regional scale in India. It is important to compare diagrams to understand all the factors involved in systems. Each of us think critically about different elements of the system. By examining each diagram, we can learn a different point of view about the same system.

Module 2 Learning Activity-Kayla Crestani

biogas_diagram_krc5347

My diagram shows the ways that biogas generators work with both the ecosystem and its biological community.  The effects of the generator are a great example of human ecology and human-environment interaction.  The diagram shows how people and the environment can work together and also mirrors a positive feedback mechanism.  Starting with the need for fuel that doesn’t cause deforestation, the generator uses animal dung in place of fire wood.  This in turn reduces the need for child labor in collecting wood to use and allows these children to devote more of their time on their education.  The generator, once done producing methane gas for cooking purposes, can then be converted to compost and then flipped to become a money making product for the people. In using the biogas generator, the interaction between humans and their environment is producing a positive feedback mechanism because there will never be an endless amount of fuel to be used.  The fuel will be produced again and again without ever running out of materials because of its ability to be reused in the form of compost and go back into the ecosystem.

While reading what Gerry Marten had to say about the biogas generator, I realized we focused on some of the same points.  While we both included and agreed that deforestation could be eliminated if these generators took over, we touched on different positive effects as well.  Marten talked a lot about the effects of deforestation and its impact on irrigation.  He also brought up the idea of introducing the generators to not only wealthy farmers, but somehow making them accessible to everyone.  While I also touched on the loss of trees, I then brought up the fact that children were sacrificing their education to provide firewood.  I also added more about the business side of making the compost into fertilizer and selling it for profit.  Marten brought a very broad look to biogas generators while I focused more on the positive effects they would bring to the people using them.  I find it very useful and eye-opening in a sense to see what can happen when social systems and ecosystems work together to create something that is beneficial all around.


Module 2: Alyssa Massaro

The core idea of my diagram is that the Biogas in India has had many positive effects and has fixed many environmental and health issues. I wanted to create a straightforward diagram that illustrated its causes and effects. For example, one cause of this creation was that deforestation was beginning to become a threat. An effect of this creation was far better health circumstances for those living in this environment. This system could be considered both a positive and negative feedback loop. It is a positive feedback loop because through the selling of compost to farmers, women are able to send their children to school. With the continuing success of the biogas technology, additional compost is needed, creating a bigger profit for women, allowing for more education. It is a negative feedback loop as well because of its effects on human health. For example, before Biogas Technology, smoke created from cooking caused respiratory issues. After Biogas Technology, the air was cleaner and the issues decreased. When comparing my diagram to Marten’s there are several differences and similarities. Both diagrams have separated the social system from the ecosystem, but Marten’s diagram uses more broad categories within those systems, (i.e. human population). He also was more detailed with his descriptions of the arrows while I used short phrases. Both, however, show the positive effects of this new technology. I believe there were differences in our diagrams because of the difference in perspective and knowledge of the subject. From Marten’s diagram, I have learned how many different causes and effects there are from this technology, including the numerous positive outcomes for the human population.

biogas_diagram_avm5862


Module 2-Biogas in India

My diagram on the movement of ways in which the introduction of the Biogas chambers have on benefiting a community. The Biogas tanks offer much more than just a source of fuel for the homes of many, but they also many jobs and food for the families affected. For example, the Biogas chambers create a fuel source, but they all decrease the harmful effects of smoke from burning dry trees. This means that people are healthier and can provide for their families longer. The Biogas chambers help to make communities more resilient. The people of each village now do not rely on the availability of trees and twigs, which will allow them to continue to cook even if something were to happen to their trees or shrubs. In addition, the villages are more stable, as a small disturbance, such as a drought, will not affect their fuel source anymore.
My diagram compared to the Marten reading is different and alike in a few ways. In my diagram, I dealt largely with the products that the Biogas chambers provided, such as increased jobs and healthier conditions. The Marten diagram, they largely dealt with the “before” aspect of the Biogas chambers. I, on the other hand, liked to look at the positives of the Biogas generators after their installation. There are similarities and differences because of the scope in which an ecosystem can be viewed. The Marten diagram viewed the ecosystem before the Biogas tanks, while I viewed the ecosystem afterwards.

Social vs. Ecosystem with Biogas in India (3)

Biogas System Diagram

In my diagram, the green sentences highlight the effects of biogas on the ecosystem and the blue sentences highlight the effect of biogas on the social system. The core idea behind this diagram is of coexistence. It describes the concept of landscape i.e how environmental and human phenomena co-exist. It also gives an idea of the IPAT equation. The diagram shows how different effects on different aspects of the ecosystem transition into different effects on different aspects of the social system. For example : the introduction of biogas plant (human impact) reduces the time of cooking and as well as reduces air pollution leading to more time for women to have a job at the vermicomposting unit and a safer environment to cook as well (environmental impact). So the positive human impact has a positive environmental impact making the IPAT equation hold.

While comparing Gerry Marten’s diagram (Fig 1.5) to my diagram I realized that most of it explains the same basic ideas. He talks about how introduction of  technology transitions into a positive impact on the ecosystem I have done the same saying how using  different resources increases productivity and saves the environment. However one of the major differences is he has given headings and I have given explanations of the transitions. I have talked about saving time and improving health, whereas his diagram talked about the knowledge it took to come up with this idea and values of public in society. The similarities and differences are there because his diagram is about ecosystem and social system as a whole i.e a  broader sense of balance between the systems while mine talks only about the effects of biogas on the systems and their relations. Through the comparison I have learnt that the society can grow and improve only as a whole as both the ecosystem and social system go together hand in hand.Biogas_azm5984

Module 2 – Laura Young


biogas_diagram_loy5066

The main idea of my diagram is to show that there is a large influence from the environment on society. The people need fuel for their fires so that they can cook and survive, but meanwhile resources, like firewood, are becoming scarce since so many people need it as fuel. This leads people to gathering more firewood than is available and then leads them to looking for other resources. Through this, it can be seen how stability in an environment like this can be a hard task to achieve, but with the addition of the biogas generator, stability can be slightly easier to achieve. Through the generator, cow dung is transformed into compost and fertilizer and this both provides for the environment and also the women of the town. As it nourishes the ecosystem, it can also be sold for money, which the women can use to pay for their children’s’ education. This diagram compared to Figure 1.5 in the Marten reading, “What is Human Ecology?” has some similarities in the format and the relative prominence the environment has on society. In terms of differences, the diagram from the reading stresses more on the smaller, but yet still influential, aspects of the social system and ecosystem (i.e. trees and shrubs on hills) while mine does not. Although these diagrams are different, it is good to see the different perspectives of what makes up the complex system between the social system and the ecosystem in this village in Karnataka, India.

Module 2- Douglas Apple

dfa5094

The core ideas behind my diagram is that is simple but it displays how human ecology is present in India. Human ecology is the relationship between the people and the ecosystem and the impact they have on each other. My diagram begins with the increasing population in India. This results in an overall decrease in wood that once fueled the fires in homes. A new idea was formulated, which is known as the Biogas Generator. It is fueled by cow dung and it replaces firewood. Children were once spending much of their day retrieving firewood for their mothers and missing out on much school work. This new advancement allow them to focus on school and the family will still have easy access to fire. The remains of the generator is mixed with worms and different material results in compost. They are making a business out of it by educating others of their new ideas, as well as making a profit to support the family. The older siblings and mothers said that this money is used to help the young children to get educated. The structure of my diagram is very similar and it covers the same basic ideas as Gerry Marten’s figure. We both go into depth on how the generator is fueled but mine is different in the fact that I touch on the compost and how they use it as a way of making money. I found it very beneficial to compare diagrams at the end because it was a way to look at human ecology in a different perspective to see how they connected the social aspect and environment.

Anthony Russo India Biogas System Diagram

biogas_avr5496-

The whole problem or cause of this system diagram is that of wood stoves in homes of poor families. The wood stoves cause household smoke which can cause health complications such as eye irritation. Another negative effect of wood stoves is the time consumption associated with collecting firewood. Children are used to help find the wood which leads to them missing school. The IT revolution in the Indian technology capital of Bangalore inspires people to be innovative. People go there and get educated with new technology so they can bring their skills back home. This is a feedback loop because the education of the people is the consequence of them taking advantage of the IT revolution. People such as D Vidya Sagar, who came from a poor area of the country, used what he learned in Bangalore to invent biogas tanks to solve the problem. Biogas tanks use cow dung from the area to produce gas which is used in electric stoves. The waste product from these tanks make a compostable substance called slurry. This substance has created jobs for women of selling the surrey to farmers to use for fertilizer. The farmers believe surrey increases their cash crop yields giving them a better profit. In both system diagrams, animal dung powers the biogas generators. One difference is the positive impact the compost has on women. The two charts can be different due to location. We can learn how huge of an impact this technology has on the local people.

Module 2- Maura McGonigal

My diagram focuses on the story behind the creation and utilization of Biogas generators. The two main causes that triggered the implementation of Biogas generators are deforestation and negative population health effects from smoke based cooking techniques. The use of Biogas generators improved the social and ecosystem.   The social system was affected by improving children’s quality of education and women’s quality of life. Since the generators provide methane directly to households, women’s cooking times are decreased, which enabled them to then take slurry waste from the generators and create fertilizer. This then affected the ecosystem by improving the quality of soil and increasing crop production.


When comparing my diagram to Gerry Marten’s diagram, I noticed one main difference. Marten’s diagram focused on all aspects of the social and ecosystem, where my diagram focuses on specific details within the social and ecosystem. I think it is important to be able to look at the system as a whole and encompass all the contributing factors. However, I also feel at times it is important to zone in on the direct effects on the system. Marten’s and my diagram showed similarities in how the social and ecosystem are intertwined through feedback mechanisms. This is an important concept because it shows how changes in the social system affect the ecosystem and vice versa. The similarities and differences in the diagrams arise from individual perspective. It is always important to consider others opinions because everyone has different life experiences, which lead to unique perspectives.biogas-mkm5257

Learning Activity

Image

Untitled document

In my diagram I focused mainly on the relationship between the social system and the ecosystem in India and the direct effects of a biogas generator. The IPAT focuses on the world scale and has intricate interactions noted, unlike the more general relationships noted in my diagram. Both of the diagrams show that there is many different ways in which these relationships interact within the larger system. Everything is connected in some way or has effects on other relationships or colorations within the larger system. The more detailed the more accurate and intricate the diagram becomes. Diagrams like this help understand the interworking’s of the different systems to help provide a better way to read data in relation to these intricate relationships.


Rachael Donnelly – Module #2

In my system diagram I focused mainly on the relationship between the ecosystem and the social system. The IPAT equation has focused attention on the world’s poor as causes of environmental problems, which we can see in the small village of India in the film.  One core value my diagram was focused around was the positive effects of Biogas Generators. These Biogas generators are powered through cow dung and water and produces compost. The compost comes from scraps of food not eaten by the villagers. The compost is then sold to farmers by the village women. These farmers grow crops from the compost and sell them off. The compost production increases the villager finances, farming, and children can become more invested in their education. The Biogas generators lead to a safer and cleaner environment. The whole process goes full circle and repeats. Before the Biogas generators the villagers used sticks collected by the children for smoke cooking. Smoke cooking took a toll on the health of the people in the village, the children’s education, and the women’s workforce as explained in my diagram. Compared to Marten’s figure, both diagrams have the social system and ecosystem on separate sides, but each has different linkages that make the process go full circle and intertwine between the two. Our arrows go both ways, which shows the need of forces from both the social end and ecosystem end. The main difference between my diagram and his is that he mentioned a lot about trees, shrubs, hills, and plant residue and made main points around them, while I mentioned nothing about them. He focused a lot on the biogas generators and I touched a lot on the issues of smoke cookers. Each person looks and interprets their diagram in a different way, and each has their own similarities and differences with each other.rld5300

Karolina Powell Lesson 2

The human-environment system presented shows the effect that a technology such as biogas use has on the social system and the eco system.  This system perspective is a very useful way to learn about all of the interactions that occur as a result of a chance such as biogas fuel.  Each arrow shown has an impact on the topic that it points to.  There are a few feedback loops shown in the systems such as the one that shows that increased education increases technology and increased technology increases the amount of time available for education.  As for Marten’s human-environment system, many of the same subjects are discussed.  For example, farms create animal dung which is then used in biogas generators and then used as compost back on the farms.  However there are clear differences in the social system.  Whereas Marten’s focuses largely on human population, mine focuses more on quality of life such as education, livelihood, and health.  Similarly, Marten’s system presentation discusses broader concepts such as irrigation water on the ecosystem side.  Therefore it is possible to have similarities and differences despite having the same topic because different viewpoints exist.  Therefore even factual evidence can be portrayed differently depending on the author and thus it is important to get multiple viewpoints for the same subject.

kwp5313 lesson 2

Module 2- Diagram- Lisa David

lyd5055 diagram


The main parts of my diagram are the Indian Society and the Ecosystem. There is a “coupledness”, biodirectional interaction, or give-and-take relationship between these two important elements. The ecosystem is made up of (but not limited to) plants, animals, water, air, land, and forests. Women are the principal caregivers in this society and therefore do almost all of the cooking. They have tapped the use of “Biotanks” which helps to preserve the ecosystem. The social organization of the Indian society is such that women and children collect the dead fibrous plants materials, cow dung found in their immediate locals, and worms and add these parts of their ecosystem to their Biotank. The women then use two main by-products of the Biotank: methane gas and compost. They use the methane gas to cook their meals (it is kinder to the atmosphere than wood stoves) and compost from the Biotank to fertilize their crops. This use of a Biotank is much more efficient and kind to their ecosystem than past methods used to sustain Indian family members.

My “Biogas Systems in India” diagram is very similar to the one shown in Marten’s, “What is Human Ecology?” I added the term “coupledness” between the two main parts of my diagram, the Ecosystem and Indian Society, which stresses their interaction. However, the way that I arranged my diagram did not lend itself to showing all of the positive and negative feedback loops and/or interactions between the parts as well as did Marten’s diagram. All in all, both diagrams show that the Indian society and ecosystem rely upon each other for a healthy survival.

Garrett Webster biofuel diagram

My diagram shows both the negative effects on the human health and the environment, but also the positive affects it can have on biodiversity and the local economy.  Firstly the social section of my diagram highlights key points that children and spending more time collecting firewood, which in turn limits their ability to succeed in school.  Also the wood burning smoke from the wood stove inside the house has a negative effect on the children’s health causing chest pain and eye irritation.  Also the women are spending so much of their time collecting firewood and it is having a negative impact on the environment.   The environment side of the diagram highlights the use of cow manure and water, which is distilled in a large tank for a day, creates methane gas.  This gas then can be attached to a stove and burned.  The leftover material from the tank is called slurry which can be combined with fibrous materials to make a high organic matter compost.  This compost can be sold to farmers which in turn can increase crop yield, which allows the farmers to sell these crops at a higher price increasing their income.  The revenue made from selling the compost is used for furthering the children’s education. 

              The diagram by Marten is very detailed and depicts how two systems are both related and interconnected.  My diagram depicts how two systems, the social and ecological, are both related and interconnected.  My diagram has a specific product which is biofuel and how this affects both systems.  In Martens diagram depicts how the systems interact with its equal. 


Biogas Diagram- Julie Cardillo

biogas_jlc6217

The core ideas behind my system diagram were to show the benefits of the biogas generator and the interactions between the social system and the ecosystem. The concept of landscape comes to mind when thinking about social system and the ecosystem of the Indian village. The main issue shown on my diagram was that women cooking had negative effects on the environment (i.e. wood collection caused deforestation) and even negative effects within their own system (i.e. health issues). The concept of biogas and the biogas generator solved those issues by using cow dung as its power source. This eliminated the demand to cut down trees for wood (deforestation) and the need for children to collect the wood. Also, my diagram shows how the women make a profit selling the compost from leftover cow dung. As long as the villagers cook with biogas, this village will most likely leave its resilience state and move onto being stable.

In comparison to Marten’s figure, mine is set up is similar. For example, we both show biogas in the social system and biogas generators in the ecosystem. However, it seems like he focuses on larger concepts (i.e. human population), while I focused on smaller concepts (i.e. women and children). I believe that the reason why there are similarities and differences between my diagram and Marten’s is simply because of perspective. In other words, Marten and I interpreted some aspects similarly, while other aspects he and I interpreted differently. What I think can be learned by comparing the two diagrams is that it is important to have multiple perspectives. The reason why is because by looking at Marten’s diagram, I was able to consider things that I probably would not have thought about prior to the comparison. As a result, I now have a better understanding of the linkages between the social and ecosystems shown in the movie.

Module 2

Biogascms6986

My diagram shows the chain of negative effects that humans have created for themselves, such as overpopulation and worsening health conditions, and how these effects have affected nature and the ecosystem. I used a systems perspective by having the two different columns represent a social system and ecosystem respectively. By adding bio generators to the ecosystem, my diagram shows how the generators can help improve all of the negative conditions that humans have created in the social system. My diagram is a combination of positive and negative feedback loops. For example, by using the generators, there is less of a need to collect firewood, which is negative feedback. However using the generators also requires people to gather more animal waste, which is a positive feedback loop. My diagram has both similarities and differences to diagram 1.5. Both diagrams talk about the human population and the needs that are created when more people are living in an area. However, my diagram focuses more on personal effects such as health and education whereas diagram 1.5 focuses more on labor and the demand for certain goods. By comparing both diagrams, we can learn that there are many different effects when comparing two different systems and how they interact. There are so many different interactions that most likely no two diagrams will ever be the same, and comparing the two diagrams allows us to see this.

Biofuel – Brenton McDonald

biogas_blm268

The core ideas in this diagram revolve around a focus on biofuel and the effects it has on both the society and the ecosystem. Due to videos primary focus on the impact this process has on the society, a more in depth approached was used in this lane of impact. The production of biofuel creates a cleaner environment which in turn allows for less pollution and better health. In addition, the production of biofuel can also be used to create organic compost, which can then be sold to produce better income or used to produce better crops. The income generated from either may then be used to pursue education. The diagram assumes that the pursuit of education is halted by lack of income or time. A futurist would argue that the due to the positive impact of technology, the overall negative impact on the environment is lessened.

The diagrams are the same in the sense that they both outline two systems, the social system and the ecosystem. They are different because my diagram details the process in which a product, biofuel, is used to affect both systems. The Marten diagram adds by detailing how each system interacts with its counterpart rather than how one product influences two systems. The man takeaway I gained from this comparison was that one can look at the effects two systems have on each other, to gain a better understanding of the overall system that results from the comparison. While my diagram outlined the products and resulting effects, it did not analyze how the systems interact with one another.

Biogas Diagram- Nicolina DiMascia

Geog 30 Biogas Diagram nmd5242

My biogas diagram is a system diagram displaying the social system and ecosystem before and after the biogas generator. Sustaining life in India requires women and children to gather firewood and cook in the house. This creates smoke, which is a health risk, and also forces children to do labor instead of schoolwork. Cutting down firewood creates a positive feedback loop. More food allows more people to survive which makes the need for firewood higher. This process was unstable. Introducing the biogas generator allowed for stability in this village. They were able to use manure to power the generator and reduce the smoke in homes for cooking. They also were able to use the slurry to make fertilizer to sell and gain money. This in return allowed farms to be more profitable, reduce the health risks of cooking smoke, and allow the labor to be cut in half for women and children. Now they will continuously have enough waste to power the generator due to the abundant farming because of the fertilizer from the generator’s waste. This provides stability for the village.

Marten’s diagram explains how everything in a social system is connected while everything in the ecosystem is connected. Human activities and ecosystem services allow both systems to become a cycle. By adding the generator in my diagram, the two systems become a cycle connecting the ecosystem to the social system. This is similar in how Marten’s diagram connects the two systems. Before the generator, the social system was greatly affected by the ecosystem which is what makes the two diagrams differ. There are differences because in some places, like India, there isn’t perfect balance between the systems, like Marten’s diagram depicts. I think the relationship between the systems depends upon the specific resources and lifestyles in each particular area being looked at.

Biogas in India

This diagram depicts the socioeconomic and economic benefits of biogas usage in India. Prior to the introduction of biogas in India, wood was widely used across the country as a source of fuel for cooking and power. The high use of wood resulted in mass deforestation, which resulted in poor and loose soil content. When flooding occurred, the soil was usually washed away and was unable to replenished as fast as areas where soil remained in tact. This made an impact on rural areas — a hard impact. With the implementation of biogas generators, it uses natural resources already made available that do not have as significant of an impact on the environment than the use of wood. By the use of animal dung, the dung sits out during the day and eventually begins to produce methane. It is place into a slurry underground and the methane is then used as a source of gas in the rural households. The slurry is then recycled into rich fertilizer for farm fields. Of which, this fertilizer is sold on the market to farmers. Therefore, poorer households have doubled their income, if not greater, and are able to support their families and or kids’ studies.

Biogas_hzs5199

Biogas_hzs5199.JPEG

As for my diagram compared to the figure in the reading: “What is Human Ecology?”, there are similarities on a relevant scale. The scale on the Marten reading shows two different diagrams depicting the social system and ecosystem. Within each are networks interconnected with respect to their significance of impact on society and the ecosystem. These two diagrams are then interconnected by the use of energy, material, and information from both systems. The diagram I devised integrates both social and ecological systems into one. You cannot have impacts solely on one system without impacts on the other, whether it is good or bad. I think in this case, it is a positive and negative feedback depending on the subdivisions within this diagram are connected to one another.

Cheers,

Harrison Sincavage

Biogas Systems

My diagram showing the relationship between the ecosystem/social system and the biogas generator is an example of the coupled human-environment systems idea. As discussed in this module not only do humans have an impact on the environment, but the environment impacts human systems as well. My diagram represents both the outcomes of the biogas generator (i.e. economic advancements) and the resources needed to fuel it (i.e. slurry and methane gas).

When comparing my diagram to Gerry Marten’s there are quite a few differences. Marten included more aspects of the social system in relation to the generator, such as the human population and the demand for cooking fuel. On the other hand, I started with the economic advancements of using biogas and did not incorporate the demand for the fuel. In regards to similarities, both graphs represent the resources needed to fuel the generator. These similarities and differences exist because of the concept of perception. Everyone views a system with a different perspective and some may see more relationships than others. Comparing these two diagrams allows one to see these different perspectives and provides information that cannot be obtained just by reading about a system. It is sometimes much easier to have a diagram in front of you to fully understand a concept, especially that of a biogas generator.

biogas_eyd5085

Biogas In India, Sutter

In my systems diagram (BiogasINDIA jds5940), I constructed a cause and effect system that shows turning to the newer technology of biogas generators can better cooking and other household chores, along with bettering their society. Importantly, utilizing the biogas generators the healthiness of the households of India will increase.  Shown in the video, in the town of Karnataka, before the biogas stoves, wood stoves were used to cook upon.  The smoke produced from the wood is health hazards to all.  Thus, replacing wood burning stoves with biogas stoves, will eliminate the breathing irritants caused by wood smoke. A secondly is the correlation between biogas generators and the local children’s education.  Specifically, the children will spend much less time gathering wood for their mother’s cooking stove, which we observed in the video caused school tardiness.  With more time, children will have more time to focus on their studies.  This is important because this will help lead to an educated population, which leads to prosperity for all.  In regard to the figure, the similarity is that both Figure 1.5 and my diagram are dealing with human interactions with the ecosystem. The difference is the scale of the diagrams. This is because my diagram deals with a specific region and issue, while Figure 1.5 is addressing the much larger scope of dealing with the entire ecosystem and social systems.  Lastly, after seeing both diagrams, you can clearly see the cyclic pattern of services and energy flowing from each side as seen in Figure 1.5.


Module 2 – Tim Granata

The core idea behind my diagram is to show how with the introduction of the Biogas Wells, the Indian people are able to use the resources that are more readily available to them (such as cow manure) to provide themselves with a cleaner and more efficient way of cooking, as well as improve their farming. Like the video, I also show how the slurry produced by the biogas wells is mixed into compost so that it may be used by farms.  This in turn allows the farms to produce improved crops as well as more of them.  These crops can then be sold at market where the population may purchase them, and the cycle repeats. I think one key aspect of the Biogas Wells is how it made the process of cooking not only cleaner, but it improved the cycle overall by making it more efficient.

Compared to the diagram in “What is Human Ecology,” the two diagrams share similar traits under both types of systems.  Mine does not include the need for child labor, since I based it off of how the system would be after the Biogas Wells were introduced.  My diagram includes an Economy section under the Social System, since the farmers were able to sell more crops due to the slurry compost mix produced by the Biogas Wells.  One thing that I think we can learn from my diagram is that due to the increased amount of crops produced, the population is able to purchase more of them. Biogas_tjg5287

Cassandra Oresko: Module #2

One of the core ideas in regards to my diagram is the effect that cow dung has on both the environment, education, and workforce of India. The human-environment system clearly shows that while humans impact the environment, the environment affects humans as well. For example, due to the use of cooking gas, this impact led to itching of the eyes, as well as cough/chest health issues. When children and females in India were collecting sticks for the use of cooking, this impact led to the decrease of trees; an overall unhappier environment due to our impacts upon each other. Once positive changes were made, for example, cow dung mix; the use of less gas and sticks caused an overall increase in the health of the humans and a cleaner environment. The use of the sticks and gas was a disturbance to both the humans and the environment, but the resilience, our ability to recover after this disturbance, led to positive changes such as increase in the workforce, education, and health. In comparison in the Marten reading “What is Human Ecology?”, both our diagrams have the two main components of social system and ecosystem. Our idea of using two-direction arrows indicates that the Marten diagram and mine both have the same general idea of the human-environment system and how they both impact each other. This is a similarity that can be learned by realizing this is a system diagram that is consisted of several components that interact, and affect each other; a systems perspective. In contrast, Figure 1.5 focuses more on the possible future benefits that biogas has towards villages, while my diagram is based upon benefits that already occurred to the villages because of the positive changes. His introduction to these benefits could lead to unknown thoughts and discussion that maybe wasn’t possibly thought about.Cassandra Oresko _ cao_5241